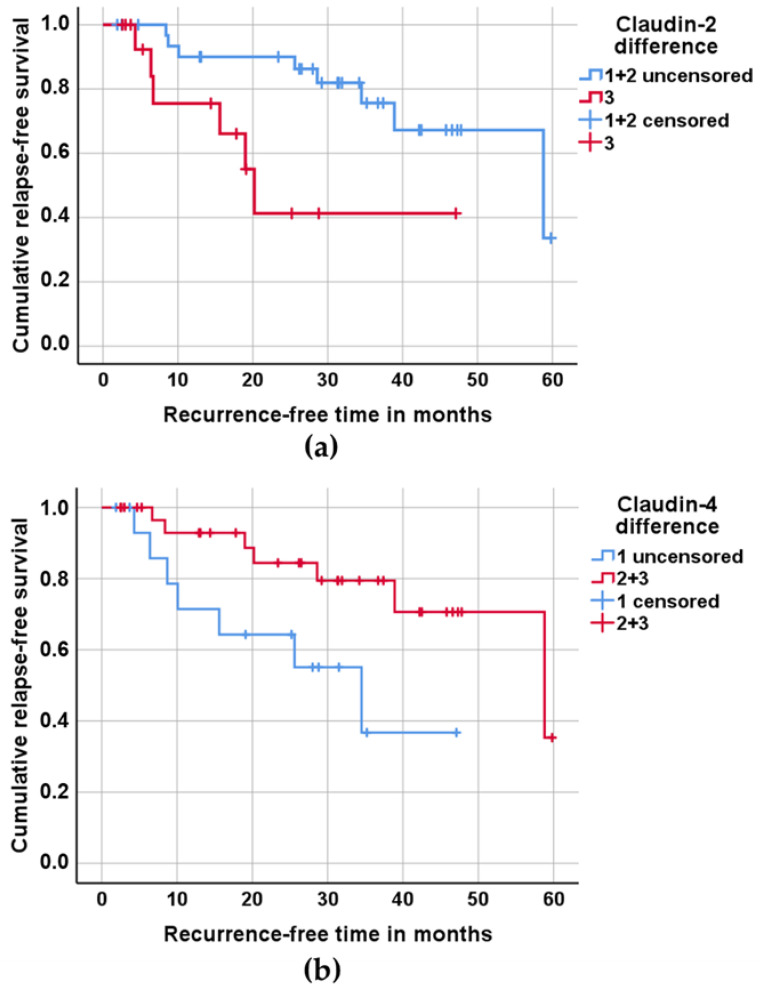
Figure 2.
Recurrence-free survival of 49 patients treated and followed up by curative treatment, depending on claudin expression. (a) For this analysis, the patients were divided into three groups of equal size based on the differences in claudin-2 expression between tumor tissue and healthy control tissue; group 1, with nearly as much claudin-2 in the tumor tissue as in the control tissue; group 3, with the highest difference in claudin-2 expression between the tumor tissue and control tissue. Groups 1 and 2 were merged for pairwise comparison between groups 1 + 2 and 3 (p = 0.01). (b) For this analysis, the patients were divided into three groups of equal size based on the differences in claudin-4 expression between the tumor tissue and healthy control tissue, with the largest difference between tumor and control in group 1 and the smallest or no difference in group 3. Groups 2 and 3 were merged for pairwise comparison between group 1 and groups 2 + 3 (p = 0.029). P-values of log-rank analysis.

