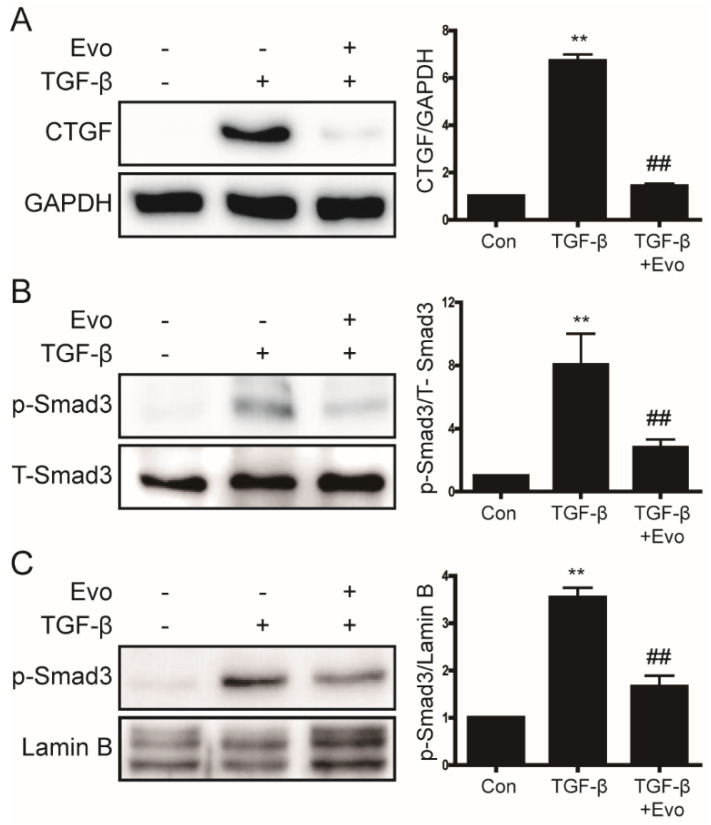
Figure 3.
The inhibitory effect of evogliptin on TGF-β-induced CTGF levels and p-Smad3 expression. (A,B) Western blot analysis of the effects of evogliptin on TGF-β-induced CTGF levels and p-Smad3 expression in primary hepatocytes. Data in the bar graphs are represented as the mean ± SEM. ** p < 0.01 relative to the control, ## p < 0.01 relative to TGF-β. (C) Western blot analyses of nuclear extracts from primary hepatocytes showing the effect of evogliptin on TGF-β-induced p-Smad3 expression. ** p < 0.01 relative to the control, ## p < 0.01 relative to TGF-β.

