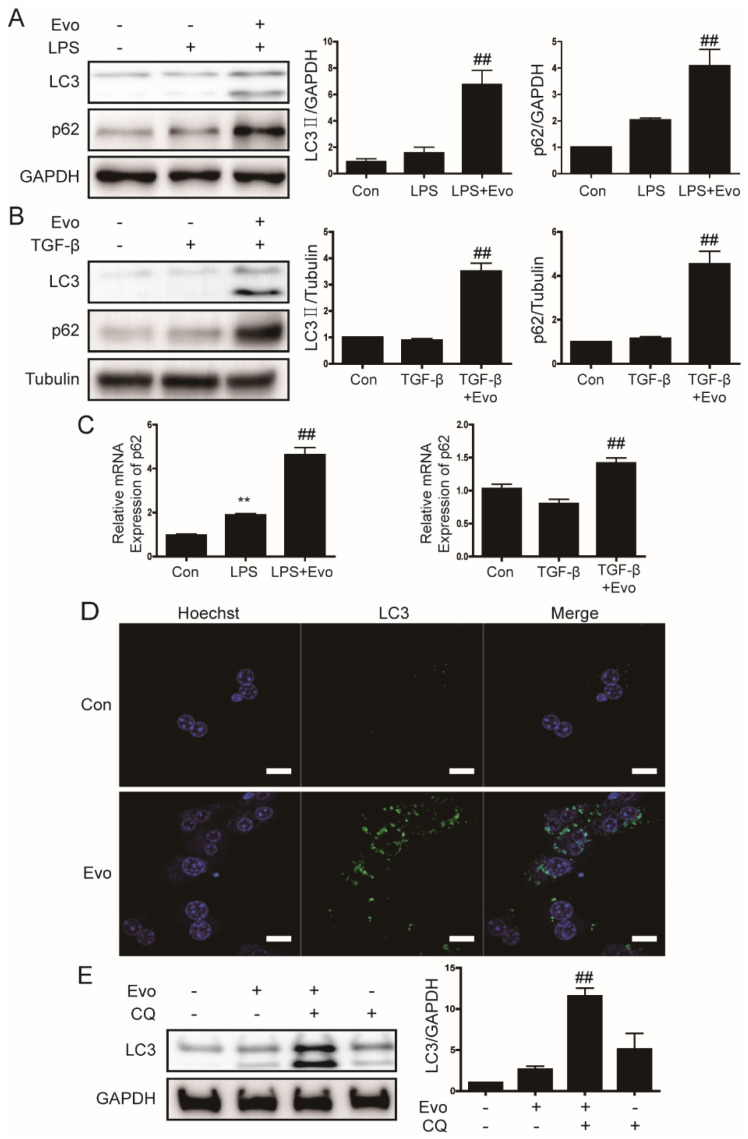
Figure 4.
The effect of evogliptin on autophagy. (A,B) Representative Western blots showing the effects of evogliptin on LC3 and p62 levels in primary hepatocytes. Data in the bar graphs are represented as the mean ± SEM. ## p < 0.01 relative to LPS or TGF-β. (C) Representative real-time RT-PCR analysis of the effect of evogliptin on p62 mRNA levels. Data in the bar graph are the mean ± SEM. ** p < 0.01 relative to the control, ## p < 0.01 relative to LPS/TGF-β. (D) Primary hepatocytes were treated with evogliptin, and LC3 puncta formation was analyzed by immunofluorescence; original magnification ×800. (E) A representative Western blot showing the effect of evogliptin and chloroquine (CQ, 10 μM) on LC3 protein levels in primary hepatocytes. Data in the bar graph are represented as the mean ± SEM. ## p < 0.01 relative to the evogliptin or chloroquine.

