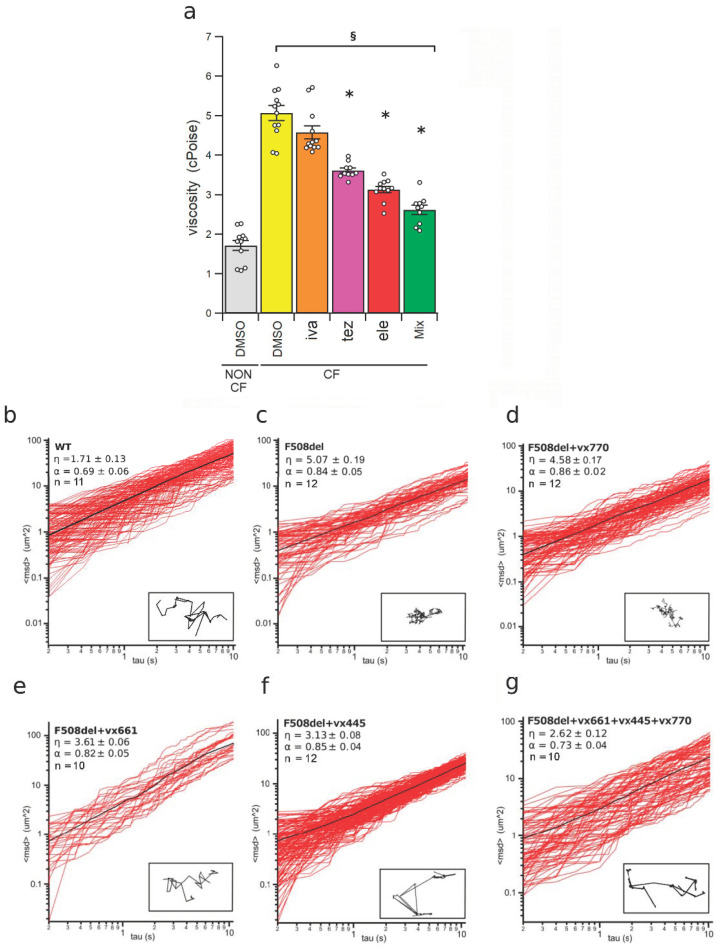
Figure 3.
Micro-rheology of the airway surface liquid (ASL) recovered from HBEC monolayers measured by the multiple particle technique (MPT). (a) Viscosity of the ASL collected from the apical side of non-CF and CF epithelia. Non-CF HBEC epithelia were incubated with a solution containing 0.1% DMSO (vehicle control) while CF HBEC epithelia were treated with 0.1% DMSO (vehicle control), 1 µM of ivacaftor (iva), 5 µM of tezacaftor (tez), 5 µM of elexacaftor (ele), 1 µM of ivacaftor + 5 µM of tezacaftor + 5 µM of elexacaftor (mix), respectively, administered on the apical side of the monolayers. The white circles in (a) represent the values of each single measure (10 ≤ n ≤ 12). The section mark (§) indicates that data are statistically different from non-CF control cells, while asterisks (*) indicate a statistical significance versus control CF cells. (b–g) Plots of the square displacement, <msd> against the time interval of ≤100 beads in the ASL samples from non-CF HBEC (WT) treated with DMSO (b) and from F508del mutant CF HBEC (F508del) treated with DMSO (c), ivacaftor (VX770) (d), tezacaftor (VX661) (e), elexacaftor (VX445) (f), and ivacaftor + tezacaftor + elexacaftor (VX661 + VX445 + VX770) (g). The average <msd> is shown as a black solid line. The values of viscosity, η, the elastic modulus, α, and the sample size, n, are indicated in each panel. The insets in panels (b–g) show the trajectory path of a bead recorded in each ASL sample.

