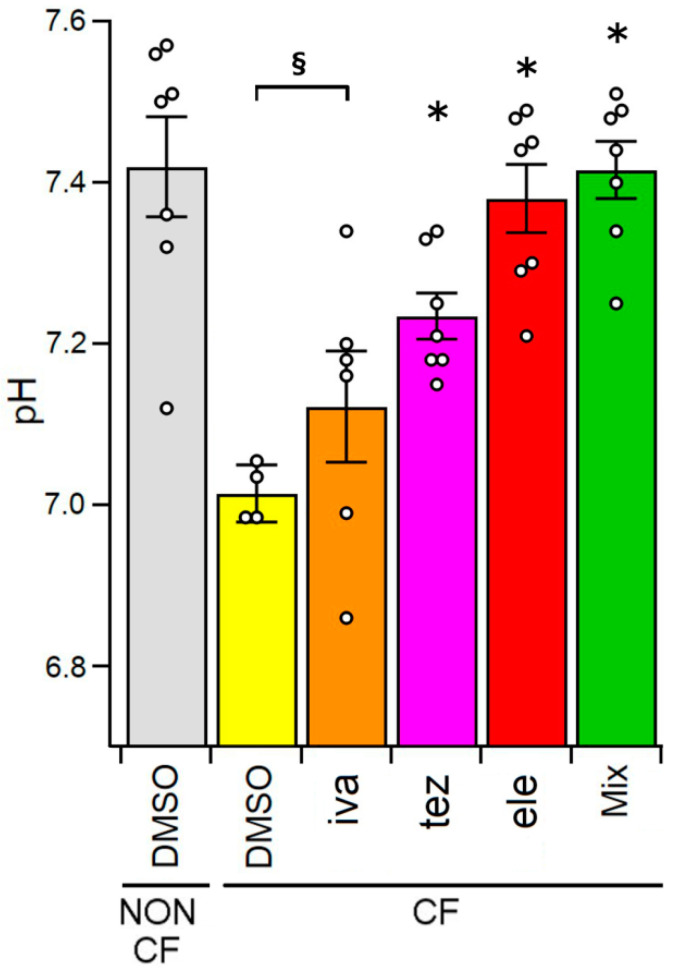
Figure 4.
ASL pH measured from non-CF HBEC epithelia treated with 0.1% DMSO (vehicle control) and from CF HBEC epithelia incubated with 0.1% DMSO (vehicle control), 1 µM of ivacaftor (iva), 5 µM of tezacaftor (tez), 5 µM of elexacaftor (ele), and 1 µM of ivacaftor + 5 µM of tezacaftor + 5 µM of elexacaftor (mix), respectively. The white circles represent the values of each single measure. The section mark (§) indicates that data are statistically different from non-CF control cells, while asterisks (*) indicate a statistical significance compared to control CF cells.

