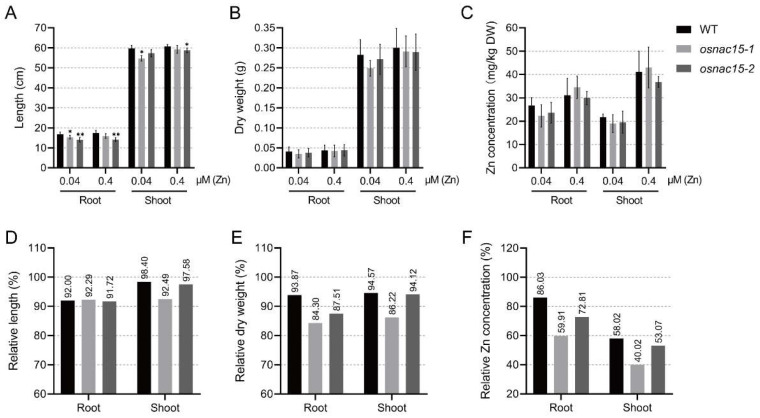
Figure 3.
Phenotypic analysis of OsNAC15 knockout lines for ZDT. Length (A), dry weight (B), Zn concentration (C), relative length (D), relative dry weight (E) and relative Zn concentration (F) of roots and shoots in the WT and knockout lines. The plants were grown in a 1/2 KB solution containing 0.04 μM or 0.4 μM ZnSO4 for 28 days. Data are represented as means ± SD of three biological replicates. * and ** indicate significant differences at p < 0.05 and 0.01, respectively, by Student’s t-test.

