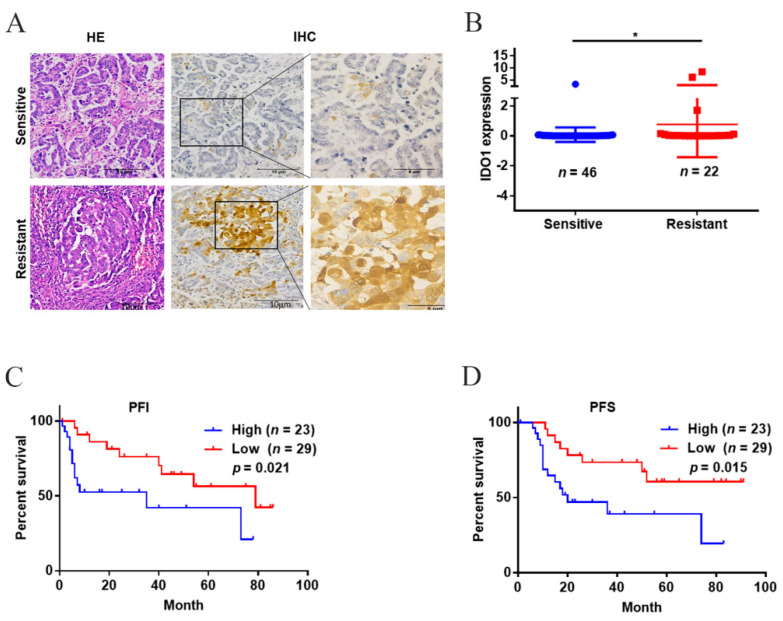
Figure 1.
The expression level of IDO1 and the prognosis in patients with ovarian cancer. (A) Representative images of IDO1 staining in cancer tissues; the scale bar was 100 μm. (B) The IDO1 expression level. (C,D) Kaplan–Meier plots of PFI and PFS in patients with type II ovarian cancer. Data were mean ± standard deviation. *: p < 0.05.

