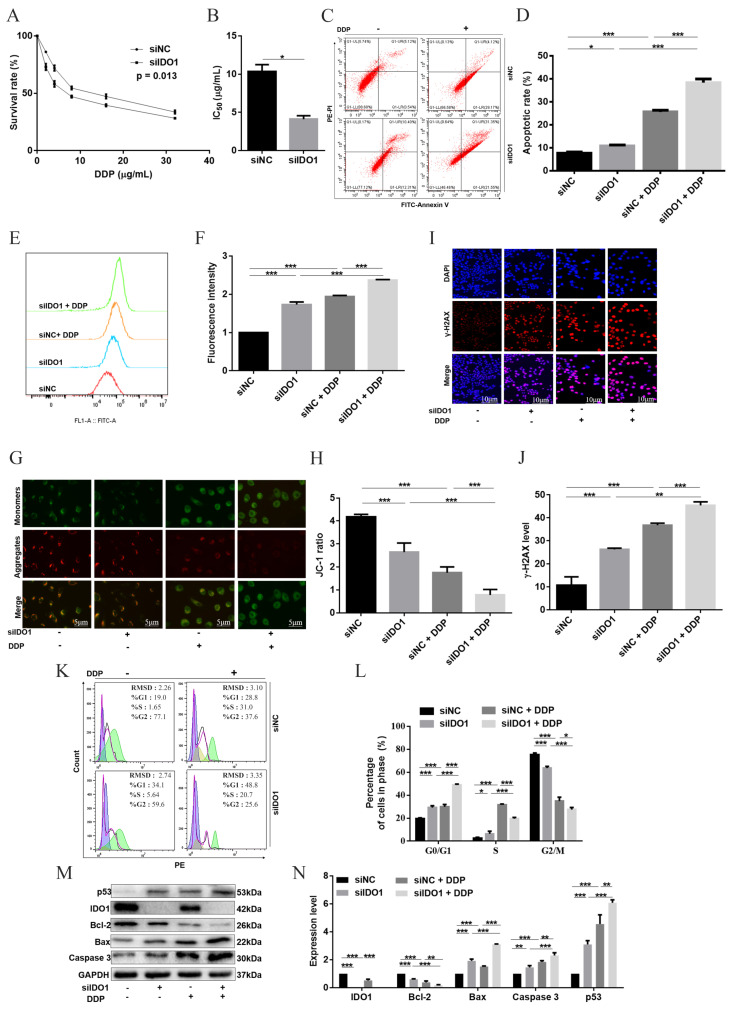
Figure 3.
Silencing IDO1 enhanced DDP-induced apoptosis in SKOV3 cells. (A,B) Cell-survival percentages and IC50 of DDP. (C,D) Apoptosis was determined by the Annexin V assay. (E,F) ROS generation was detected by flow cytometry. Data were expressed as mean fluorescence intensity. (G,H) MMP determined with the JC-1 assay; representative images of J-aggregates (red) and monomer (green); the scale bar was 5 μm; JC-1 ratio reflected MMP. (I,J) DNA damage marker γ-H2AX assayed with immunofluorescence (red), cells were counterstained with DAPI to visualize nuclei (blue); representative images; the scale bar was 10 µm; the fluorescent intensity indicated the γ-H2AX level. (K,L) Cell cycle examined by flow cytometry. (M,N) Apoptosis-related proteins analyzed by western blot. Data were mean ± standard deviation for 3 independent trials. *: p < 0.05; **: p < 0 .01; ***: p < 0 .001.

