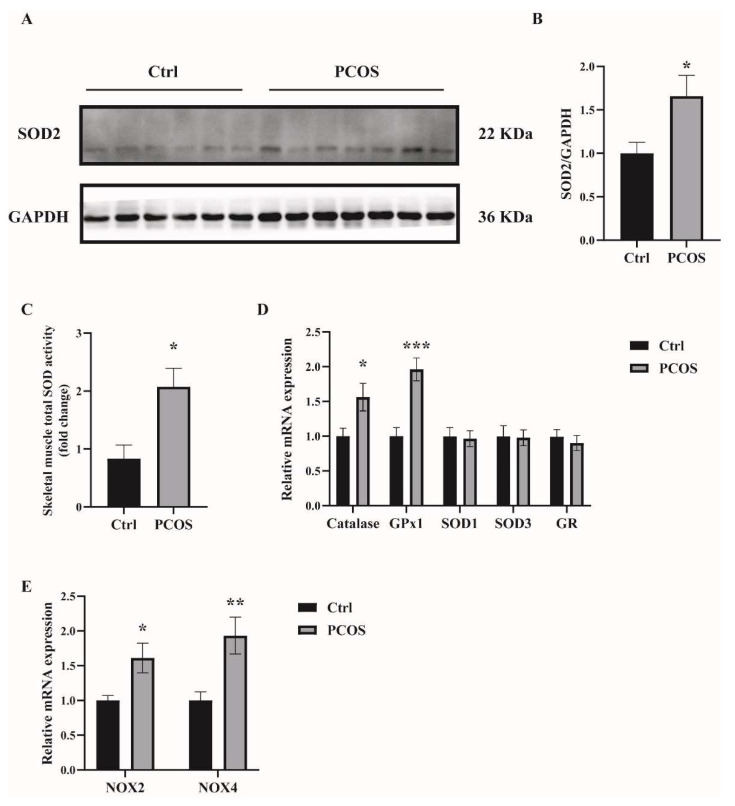
Figure 2.
The expression of antioxidant-related genes in the skeletal muscles of the mice. (A,B) Western blot analysis and densitometry quantification of SOD2 in skeletal muscles of PCOS and control mice. (C) Total SOD activity in the skeletal muscles of PCOS and control mice. (D) Relative mRNA levels of the genes Catalase, GPx1, SOD1, SOD3, and GR in the skeletal muscles of PCOS and control mice. (E) Relative mRNA levels of the genes NOX2 and NOX4 in the skeletal muscles of PCOS and control mice. Asterisks indicate significant differences between control and PCOS mice. The data are presented as means ± SEM. *, p < 0.05, **, p < 0.01, ***, p < 0.001, n = 6,7 per group.

