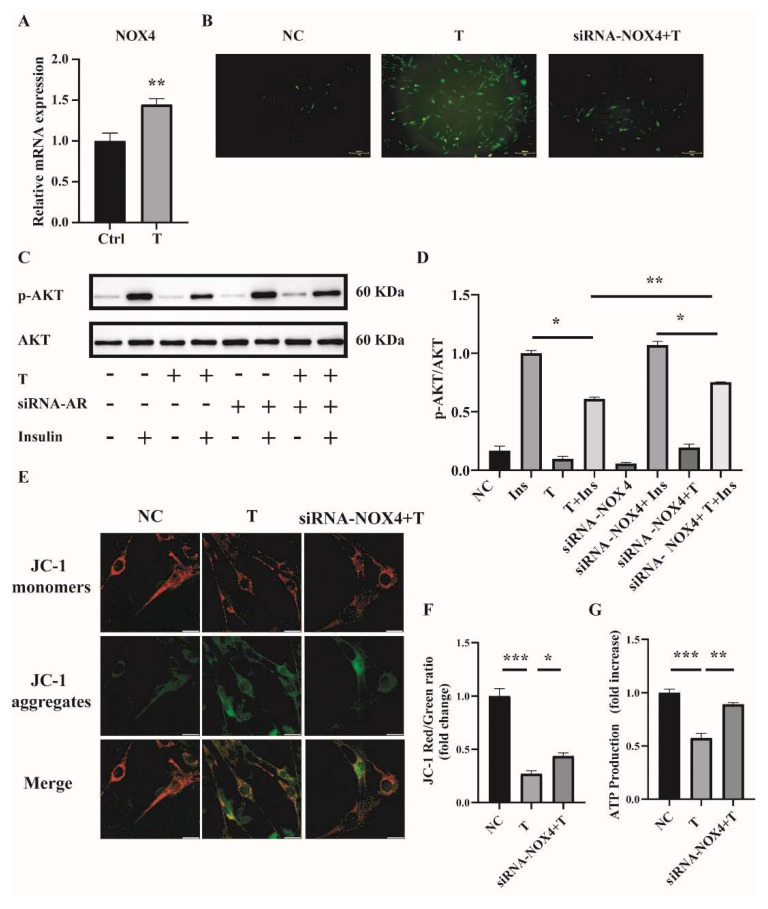
Figure 5.
NOX4 expression in T-treated C2C12 cells and effects of NOX4 on mitochondrial function. (A) Fully differentiated C2C12 cells were treated with T (0 and 10−5 M) for 12 h. Relative mRNA levels of NOX4 in the cells. (B) Representative photomicrographs of intracellular ROS in C2C12 cells. Fully differentiated C2C12 cells were transfected with siRNA-NOX4 or non-silencing RNA and then treated with T (0, 10 μM) for 12 h. Intracellular ROS levels were determined by DCFH-DA staining. Scale bar= 200 μm(C) Insulin-signaling assay. (D) Densitometry quantification of pAKT/AKT of the insulin-signaling assay in C2C12 cells. (E) The mitochondrial membrane potential (ΔΨm) was determined by JC-1. Scale bar = 25 μm. (F) The ratios of JC-1 aggregate/monomer were analyzed by the Image J program. (G) Normalized ATP production. The data are presented as means ± SEM of three independent experiments. *, p < 0.05, **, p < 0.01, ***, p < 0.001. T, testosterone; Ins, insulin.

