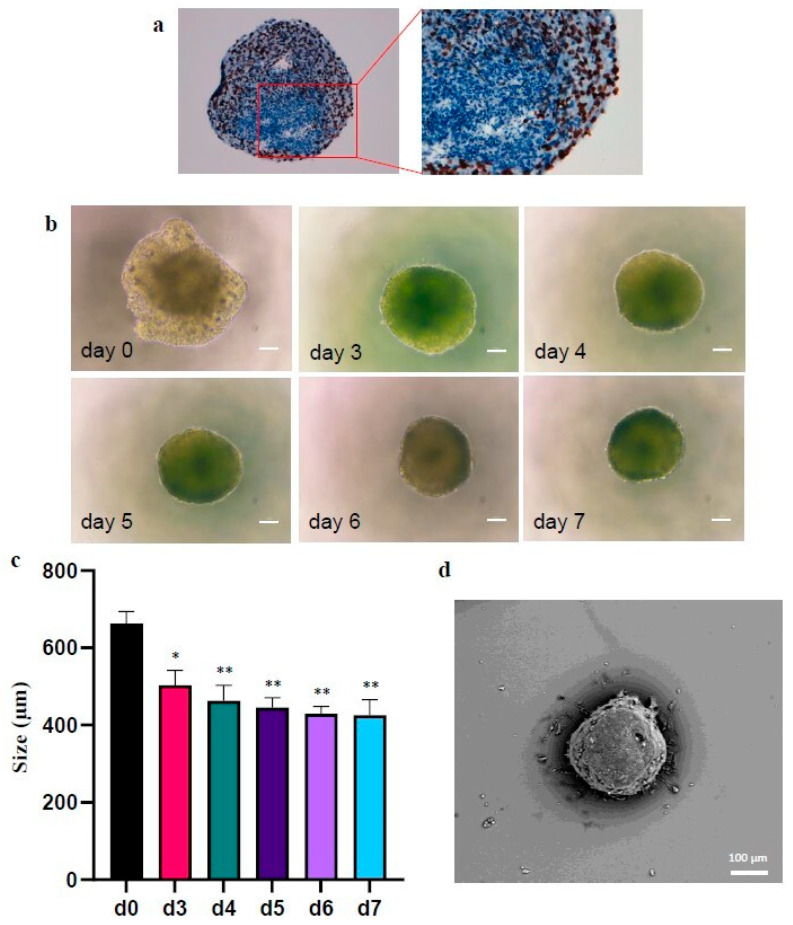
Figure 2.
Morphology and size of a CABA I representative spheroid. (a) Ki67 staining of a representative spheroid (conventional immunohistochemical staining procedure). 20× magnification for the left image, 40× magnification for the right image; (b) Images of a representative CABA I spheroid at d0, d3–d7 from the transfer onto low attachment surface; the size bar is 100 µm. (c) Graph reporting the mean size (mean of two repeated measures of diameter) of the representative spheroid at days 0–7 (mean ± SD) (* p < 0.05; ** p < 0.01). (d) SEM image of a representative CABA I spheroid; the size bar is 100 µm.

