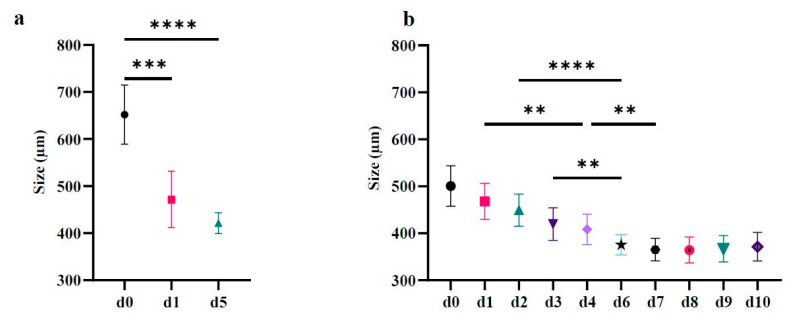
Figure 3.
Size trend over days of CABA I spheroids. (a) Mean ± SD of 14 spheroids observed on d0, d1 and d5. (b) Mean ± SD of 35 spheroids observed on d0-d10. Kruskal–Wallis test followed by Dunn’s post-hoc test (** p < 0.01; ***: p < 0.005; **** p < 0.001). In each graph, asterisks on horizontal bars represents the statistical significance between the two values selected. In b, all values, starting from d3 are statistically significant compared to d0 (**** p < 0.001; only d3 ** p < 0.01).

