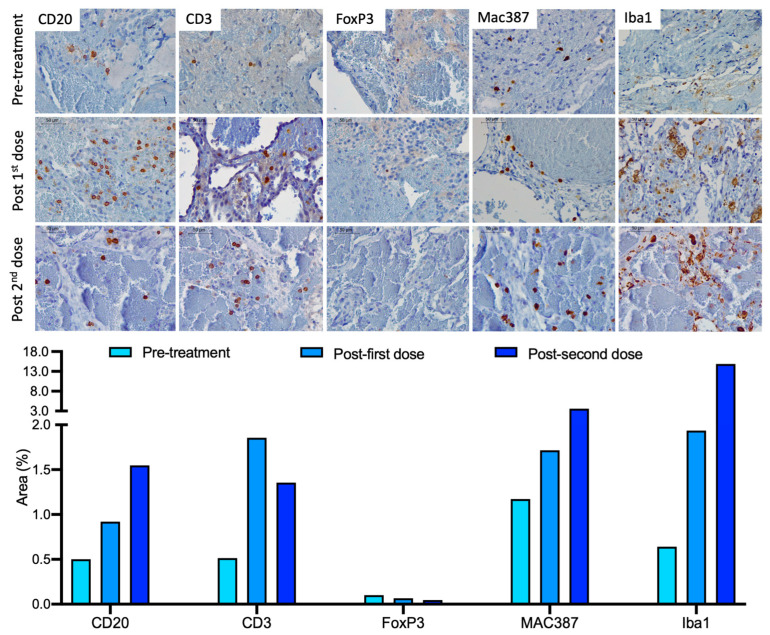
Figure 4.
Infiltrated immune cells in the tumor. Tumor tissue pre-treatment (obtained during the first craniotomy), post-first dose (obtained during the second craniotomy) and post-second dose (obtained during necropsy) (top to bottom in each row) were evaluated for the infiltration of B cells (CD20+), T cells (CD3+), regulatory T cells (FoxP3+), M1 macrophages (Mac387+) and activated microglia/macrophages (Iba1+). Scale bar: 50 μm. The graphic representation shows the area (%) of the positive cells (brown) for each marker.

