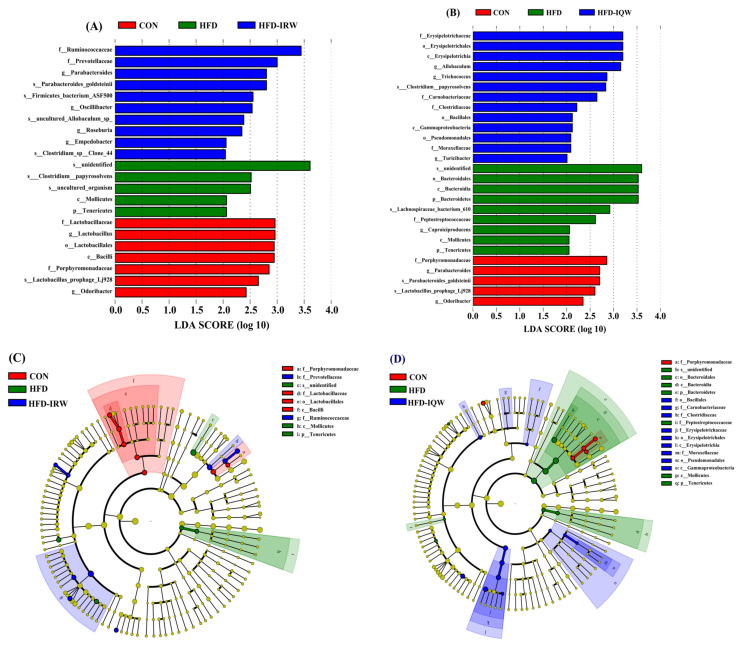
Figure 6.
LEfSe analysis of microbiota in colon content. Linear discriminant analysis among (A) and (C) CON, HFD, and HFD-IRW, (B) and (D) among CON, HFD, and HFD-IQW. The red, green, and blue nodes in the phylogenetic tree signify the microbial species which perform a vital role in the groups. The yellow nodes signify the species with no significant difference.

