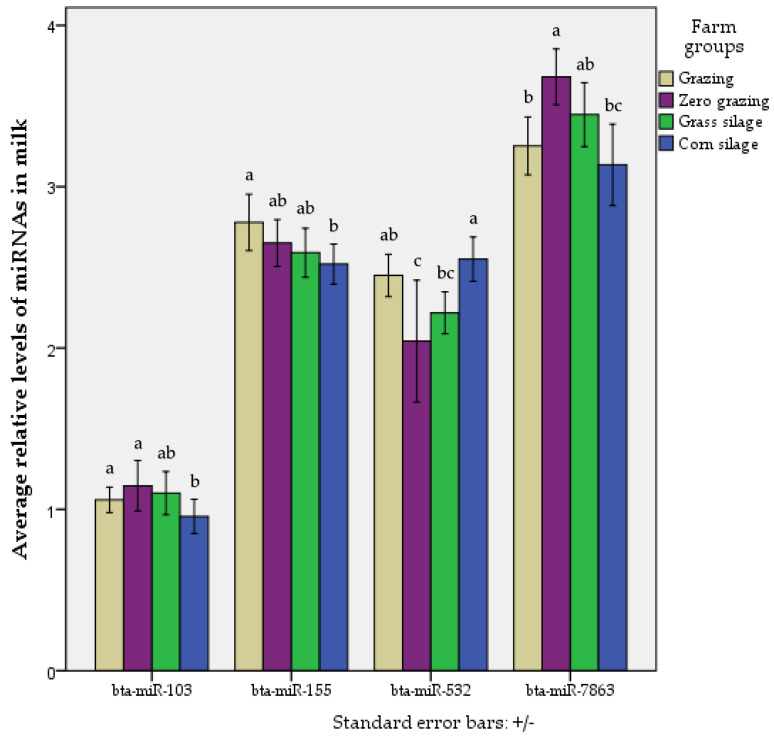
Figure 1.
Average relative levels of the miRNAs bta-miR-103, bta-miR-155, bta-miR-532, and bta-miR-7863 in raw milk from grazing (n = 44), zero-grazing (n = 13), grass silage, (n = 10), or corn silage (n = 45) milk production systems. The bar chart shows the average of miRNA levels in each farm group, and the standard error bars. Different letters show significant difference between groups.

