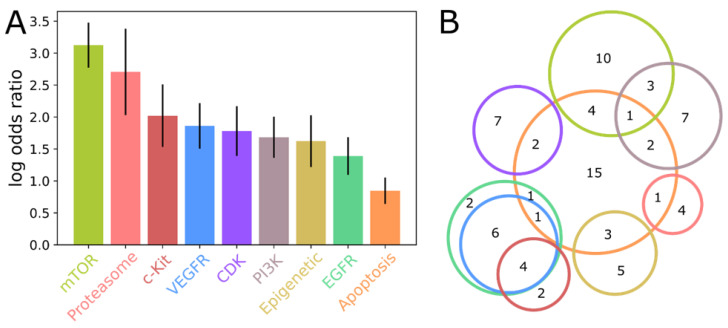
Figure 2.
Enrichment analysis of molecular targets associated with SARS-CoV-2 activity. (A) The extent of enrichment, measured as log odds ratio, for nine targets significantly enriched in SARS-CoV-2 active compounds. (B) Venn diagram illustrating the degree of overlap amongst enriched targets. The colour scheme is shown in (A), and the number of active compounds contributing to each target combination is also shown.

