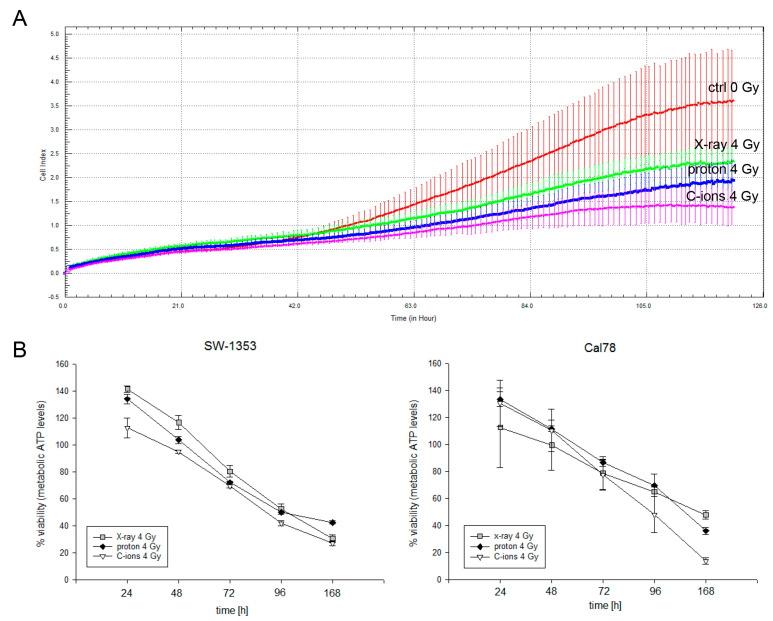
Figure 3.
Proliferation and cell viability analysis after 4 Gy X-ray/proton/C-ions IR. (A) xCELLigence real-time proliferation analysis (red: non-IR controls; green: X-ray 4 Gy; blue: proton 4 Gy (LET 2.9 keV/μm); magenta: C-ions 4 Gy (LET ca. 55 keV/μm)); (B) the percentage of metabolic ATP levels, which is representative for the viability of the cells (mean ± SD; n = 3; measured in quadruplicates). The direct comparison of the three types of IR showed a slight gradation of the cellular response with the strongest effect with C-ions.

