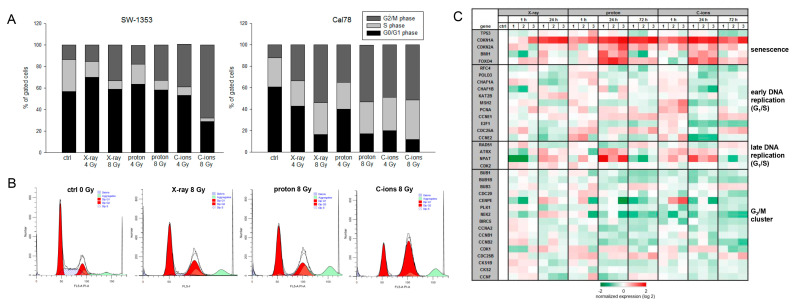
Figure 4.
Cell cycle analysis. (A) Chondrosarcoma cells were analyzed using flow cytometry 24 h after 4 Gy and 8 Gy X-ray/proton/C-ions IR. The corresponding statistical evaluation shown in stacked bar charts (n = 4). (B) Representative original tracks of non-IR control cells (ctrl) and one measurement of each IR type (8 Gy) are shown. (C) Heatmap blot of RNA sequencing data of relevant cell cycle regulator genes presented in log2 fold-change 1 h, 24 h, and 72 h after 4 Gy X-ray/proton/C-ions IR (n = 4).

