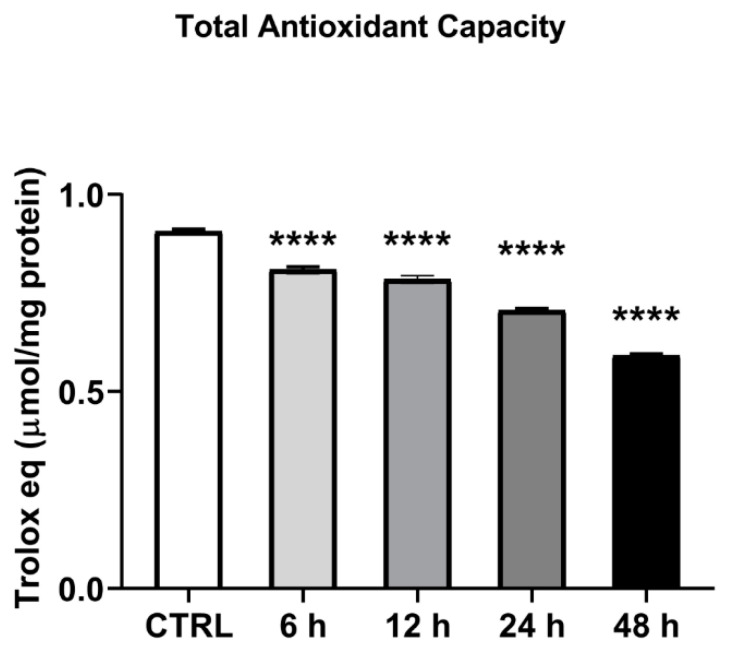
Figure 3.
H2O2 treatment and total antioxidant capacity. C2C12 myoblasts were treated with H2O2 0.3 mM for different times (6–48 h) and cell lysates were tested for TAC analysis. TAC levels were expressed as micromoles of Trolox equivalents/mg of protein tested. Data presented are the mean ± SEM of three experiments, each performed in triplicate. One-way ANOVA was performed followed by Bonferroni’s multiple comparisons test **** p < 0.0001 vs. CTRL.

