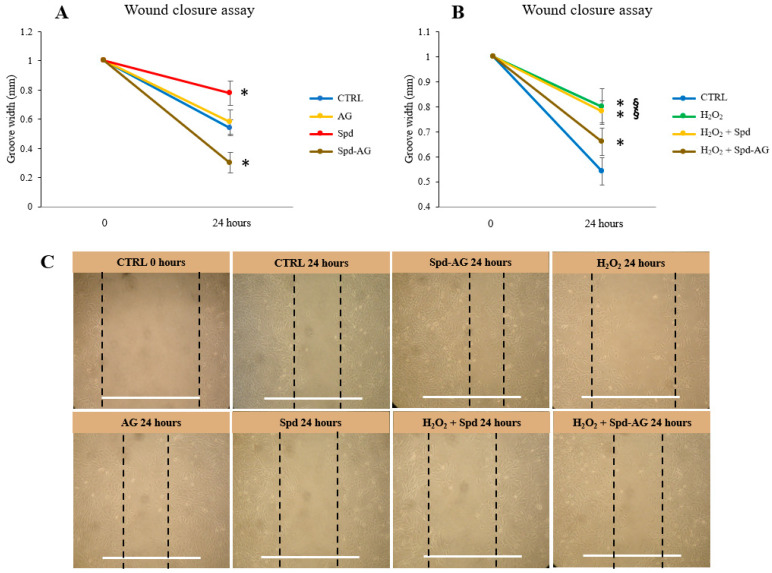
Figure 6.
Wound closure assay. Before each treatment, a wound of 1 mm was created in the culture plate. Cells were treated with Spd 10 μM, AG 1 mM, H2O2 0.3 mM and combined treatments or a vehicle for 24 h. The sulcus width was then measured in control and treated cells. (A) Effect of Spd, AG and Spd-AG. (B) Effect of H2O2 and combined treatment with Spd and Spd-AG. (C) Representative images of all treatments. White bars correspond to 1 mm. Data and representative images presented are the mean ± SD of three experiments, each performed in triplicate. One-way ANOVA was performed, followed by Bonferroni’s multiple comparison tests. * p < 0.05 vs. CTRL; § p < 0.05 vs. H2O2.

