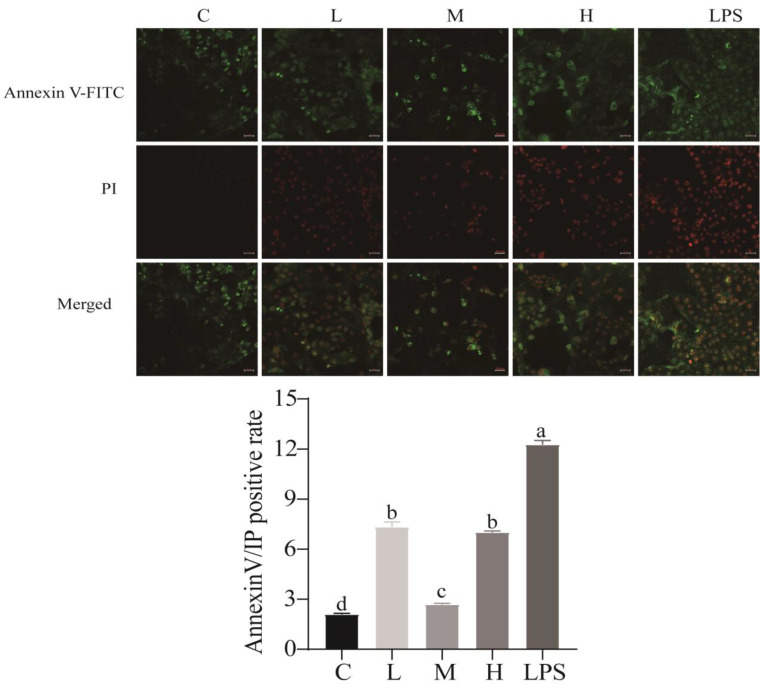
Figure 3.
Effects of L. rhamnosus CY12 on the intracellular concentrations of apoptosis in LPS-induced Caco-2 Cells. Note: C represents uninduced Caco-2 cells; L, M, and H represent LPS-induced Caco-2 cells co-incubated with 107, 108, and 109 cfu/mL L. rhamnosus CY12, respectively; LPS represents LPS-induced Caco-2 cells. Means with the different letters (annexin V/IP positive rate) are significantly different p < 0.05. The magnification of these picture is 100X, and scale bar is 50 µm. The early apoptotic cells showed green fluorescent light under the microscope. The late apoptotic cells showed red and green fluorescent light under the microscope, and normal cells displayed no fluorescence.

