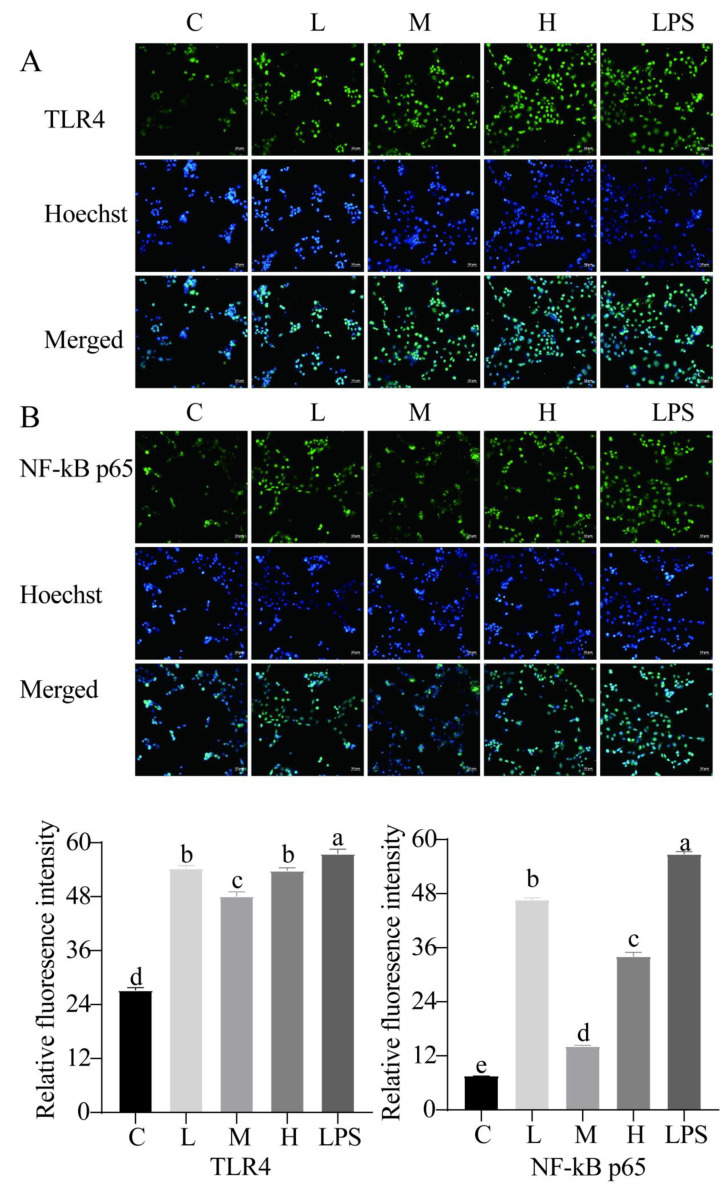
Figure 7.
Effects of L. rhamnosus CY12 on the immunolocalization and relative fluorescence intensity of TLR4 and NF-κB p65 in LPS-induced Caco-2 Cells. (A). TLR4. (B). NF-κB p65. Note: C represents uninduced Caco-2 cells; L, M, and H represent LPS-induced Caco-2 cells co-incubated with 107, 108 and 109 cfu/mL L. rhamnosus CY12, respectively; LPS represents LPS-induced Caco-2 cells. Data were presented as mean ± SEM. Means with the different letters are significantly different p < 0.05. The magnification of these picture is 100X, and scale bar is 50 µm.

