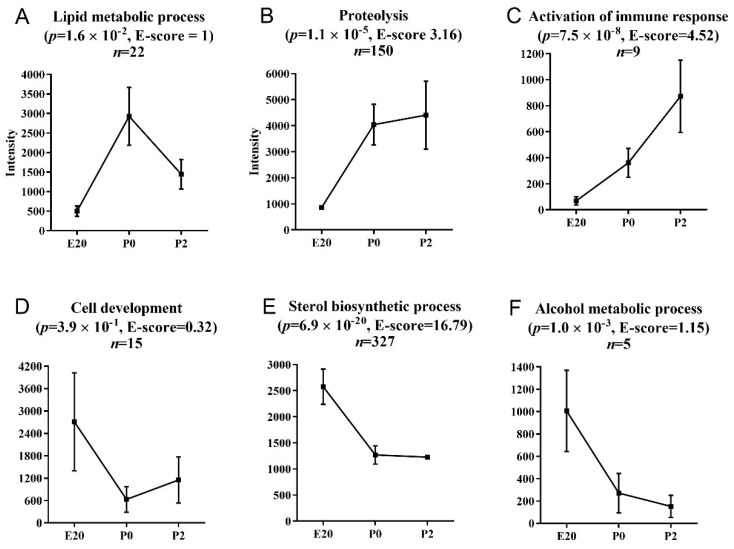
Figure 3.
Functionally annotated gene clusters in normal perinatal rat pancreas samples. Differentially regulated transcripts in perinatal rat pancreas were clustered according to expression profiles over time and analyzed for enriched functional annotations using DAVID Functional Annotation Clustering. The most significantly enriched biological process in the highest scoring cluster is presented above each graph. Data points represent mean intensities of the associated gene cluster at the given time point. (A) Lipid metabolic process, (B) proteolysis, (C) activation of the immune system, (D) cell development, (E) sterol biosynthetic process, (F) alcohol metabolic process. Error bars (SE) are included to illustrate the variability in expression levels. p-value: modified one-tailed Fisher’s exact probability value (EASE score); E-score: enrichment score, the geometric mean (in -log scale) of a member’s p-values (EASE scores) in the corresponding annotation cluster.

