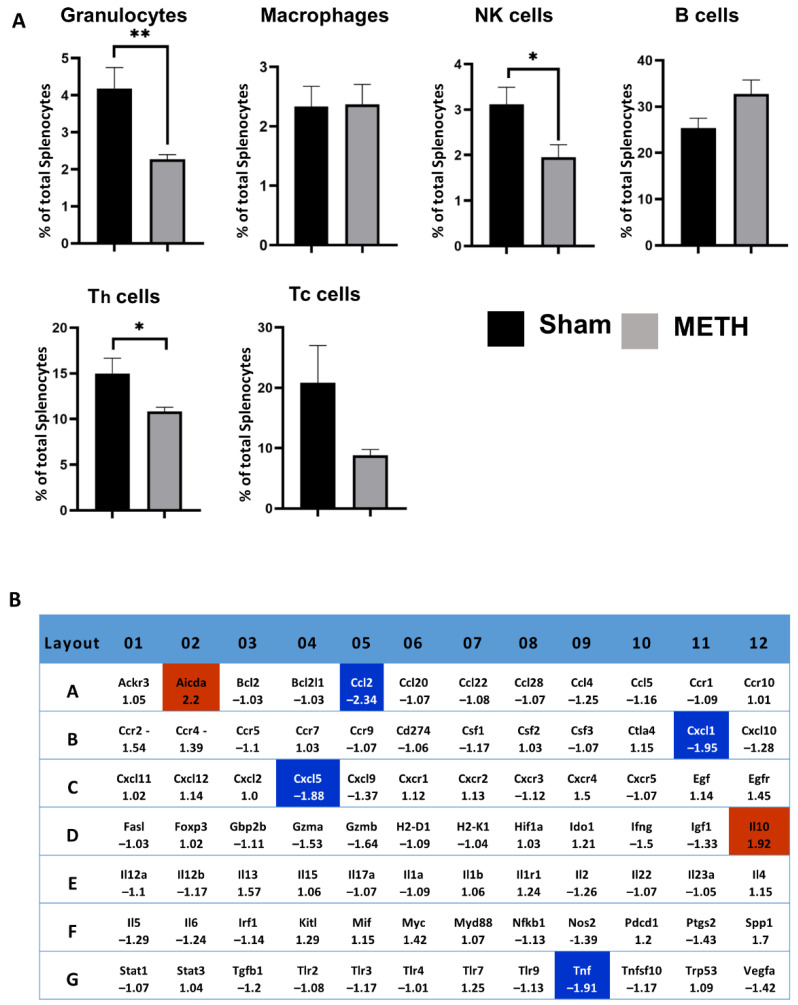
Figure 8.
Cellular and gene changes in the spleen. (A) Percentage of splenocyte cells (granulocytes, macrophage, natural killer (NK) cells, B cells, helper T (Th) cells, and cytotoxic T (Tc) cells), at time = 3 h following METH administration. Figures show % total splenocyte cells ± standard error of the mean (SEM) with respect to the mean of shams, ** p < 0.01, * p < 0.05. (B) RT2 Profiler PCR gene array showing upregulated (red) and downregulated (blue) fold-change mRNA gene expression in the spleen of the sham- and METH-treated groups.

