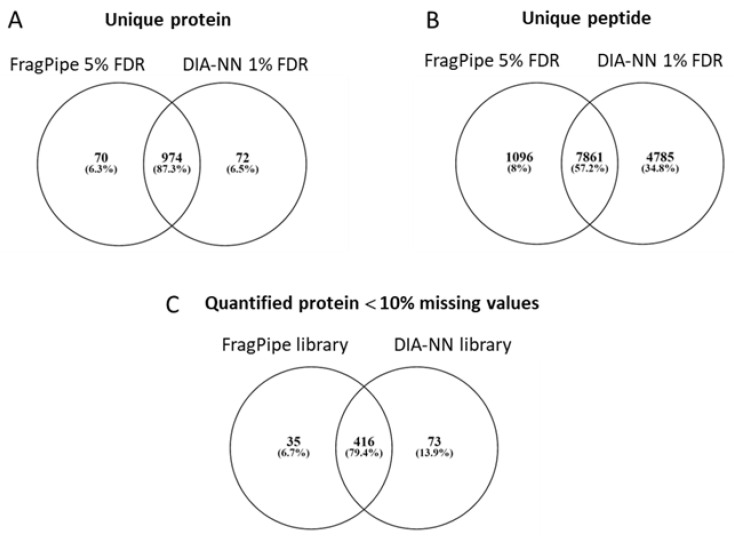
Figure 2.
Comparison of libraries and quantified results from FragPipe and DIA-NN analysis. (A,B) Venn diagram comparing unique proteins (A) and unique peptides (modified and unmodified; (B)) identified in the two libraries. (C) Venn diagram comparing protein groups with less than 10% missing values quantified with DIA-NN using the combined FragPipe library or DIA-NN library-free mode. FDR: false discovery rate.

