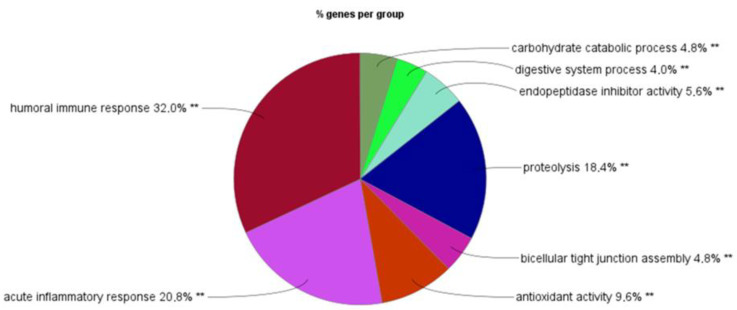
Figure 4.
Gene ontology of the biological process. Gene ontology analysis of the 86 human genes associated with the 80 protein markers using the GO_BiologicalProcess-EBI-UniProt-GOA-ACAP-ARAP (22–04-2022) reference term database with the ClueGO (v.2.5.8) plug-in in the Cytoscape software (v.3.9.1). In total, 125 genes picked from 69 of the 86 genes were clustered between the eight main groups of biological process-related terms. On the pie chart, the groups are named based on their leading (most significant) term, and the size of the segment is defined by the % of associated genes per group calculated from the total picked genes. Group-corrected p value calculated by ClueGO with the Bonferroni step-down method: ** p < 0.001.

