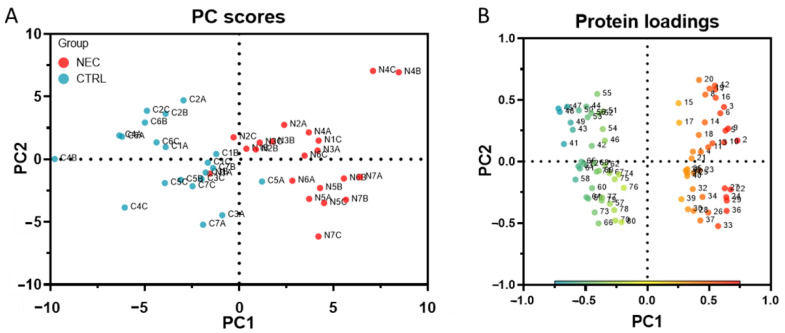
Figure 5.
PCA of the 80 protein markers. (A) The PC score plots illustrate the relationship between the NEC (N1 to N7 group A, B, C: in red) and non-NEC control (C1 to C7 group A, B, C: in blue) samples when the dimensionality of the dataset is reduced to its two principal components (PC1: x-axis; PC2: y-axis). (B) Protein loadings show how each protein marker (increased in NEC: from 1 to 40; decreased from 41 to 80; see Supplementary Table S1 for corresponding protein name) is correlated with the two principal components of the PC score plots.

