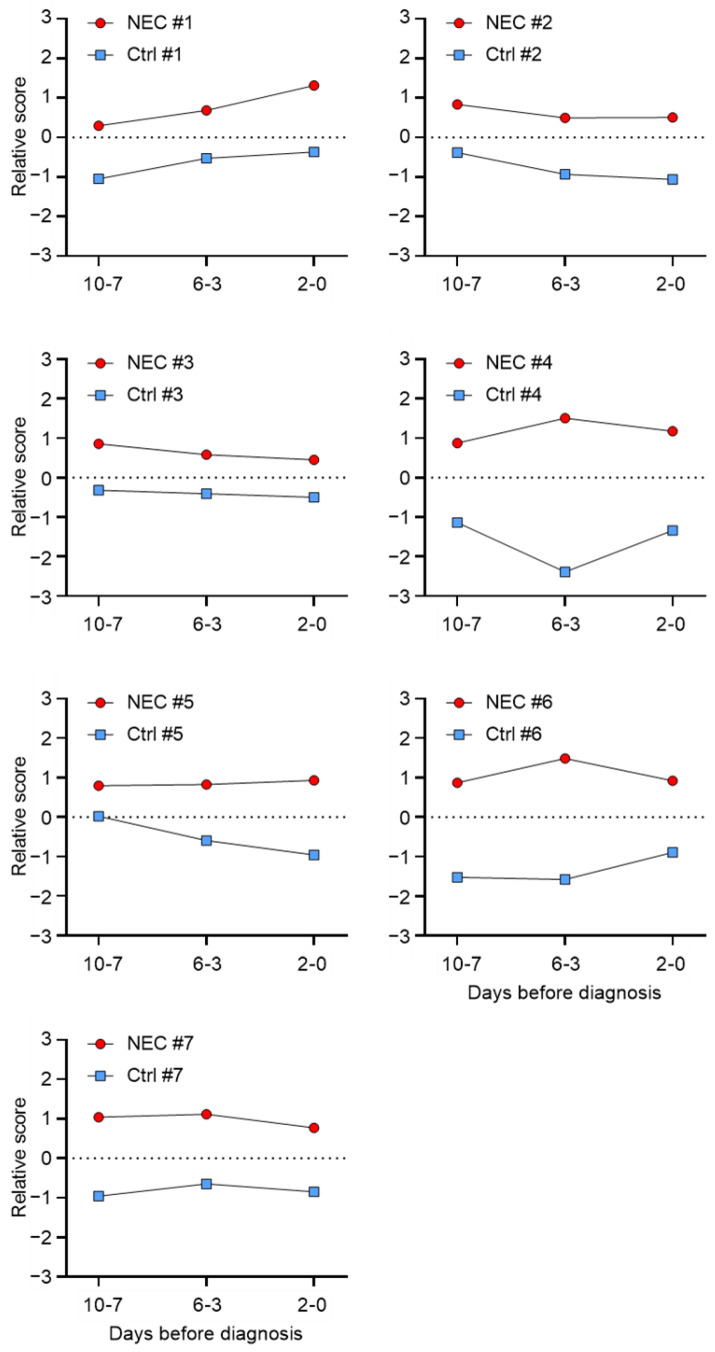
Figure 8.
Relative score according to paired samples. Plots of the relative score (Y-axis) of the 36 protein marker levels across the three tested periods (X-axis: 10-7, 6-3, 2-0 days before NEC diagnosis) for each of the 21 paired NEC (red dot) and non-NEC control (blue square) samples from the seven paired cases. The two-tailed paired t test on the 36 protein markers (increased and decreased; multiply by −1) gave a significant difference of at least p ≤ 0.05 for all the pairs of the samples.

