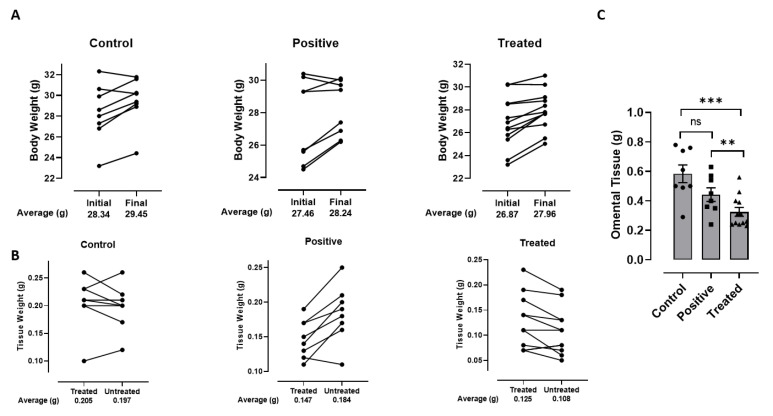
Figure 2.
In vivo effect of GATA3 inhibition on (A) total animal weight between start and end of experiment, (B) weight of SAT tissue between treated (site of injection) and untreated (control) sites, and (C) weight of omental tissue. Bar graphs show paired data for each mouse for n = 6–12 animals per group. Statistical analysis was determined by paired (A,B) and unpaired (C) t-test (** p < 0.02, *** p < 0.01).

