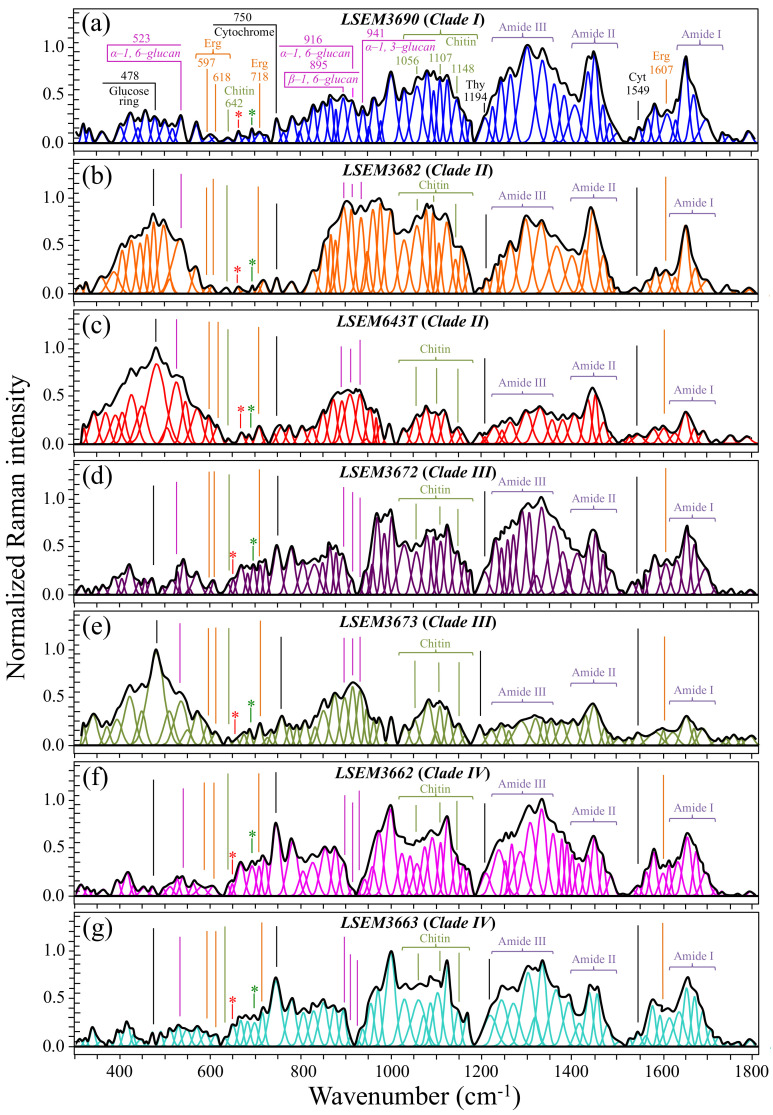
Figure 2.
(a–g) Deconvoluted Raman spectra for the seven investigated samples of C. auris (cf. labels in inset). Each spectrum represents the average of 20 spectra collected with a 20× objective lens on each sample at different locations. Band assignments in inset are discussed in text (wavenumbers are in cm−1 units); red and green asterisks locate signals from ergosteroids and β-chitin allomorph, respectively.

