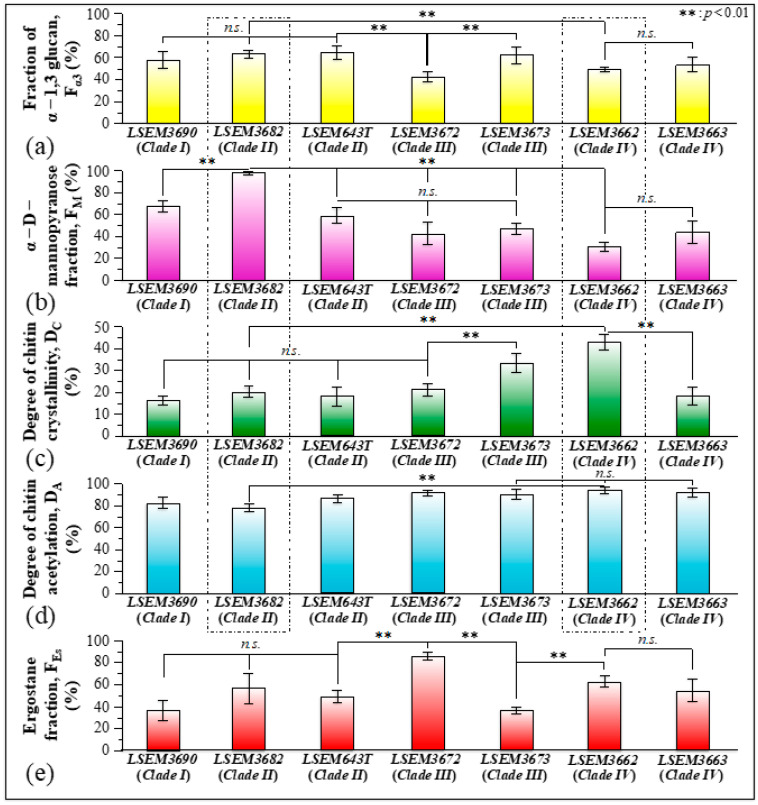
Figure 10.
Metabolite fractional parameters (a–e): Fα3, FM, DC, DA, and FEs (cf. labels), as determined from Raman experiments on the investigated C. auris samples. Standard deviations are indicated in inset together with statistical evaluations performed on Raman maps collected at different locations (n = 3; with significance p < 0.01 labeled with **).

