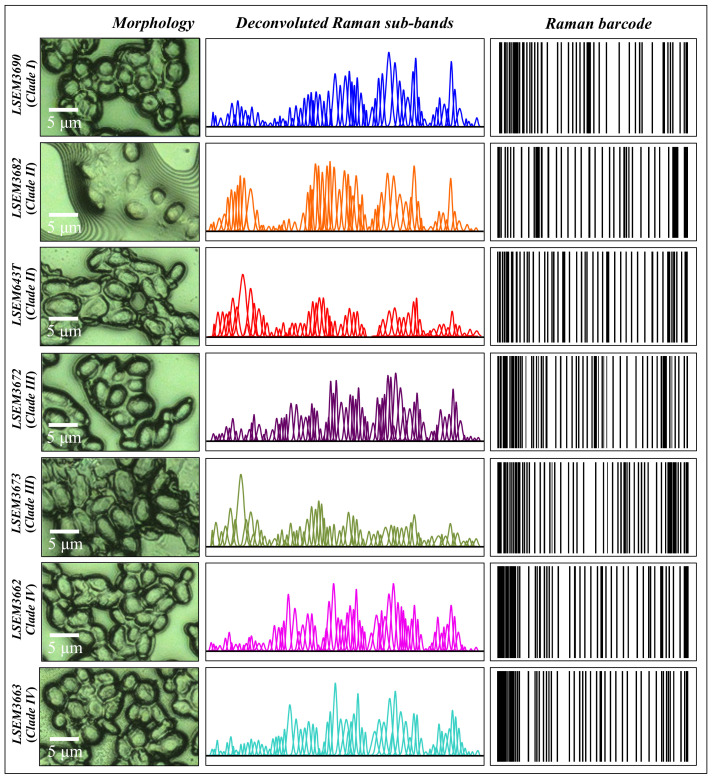
Figure 12.
From left to right: high-resolution micrographs of different C. auris clades/subclades (cf. labels in inset), series of Gaussian–Lorentzian subclades (i.e., the same as those shown in the deconvoluted spectra of Figure 2) obtained from a machine-learning-based spectral deconvolution (cf. Section 2.3) for each sample, and Raman barcodes computed from the respective sub-band sequence according to the algorithm described in Section 2.4.

