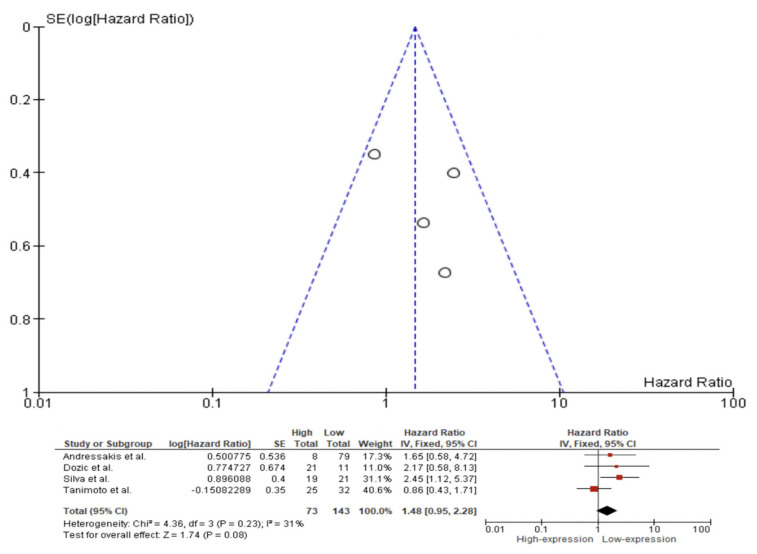
Figure 4.
Forest plot and funnel plot for the association of higher Caspase 3 expression with overall survival. Squares represent study-specific hazard ratios; horizontal lines represent 95% confidence intervals (CIs); diamonds represent the overall hazard ratio estimate with its 95% CI [5,14,27,70].

