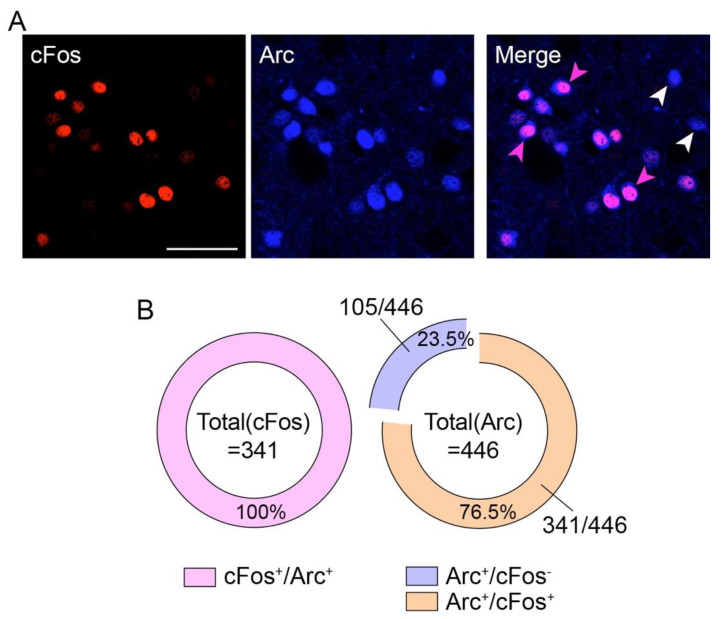
Figure 2.
Spatiocellular organization of haloperidol-induced cFos and Arc. (A) Double immunofluorescence detection of cFos (red) and Arc (blue) following haloperidol administration. Scale bar: 50 μm. Arrows in magenta indicate the co-expression of cFos and Arc in the same neurons, whereas arrows in white indicate the expression of Arc (no cFos co-expression). (B) Quantification of the degree of colocalization between cFos and Arc. Note that 23.5% of Arc+-neurons did not express cFos.

