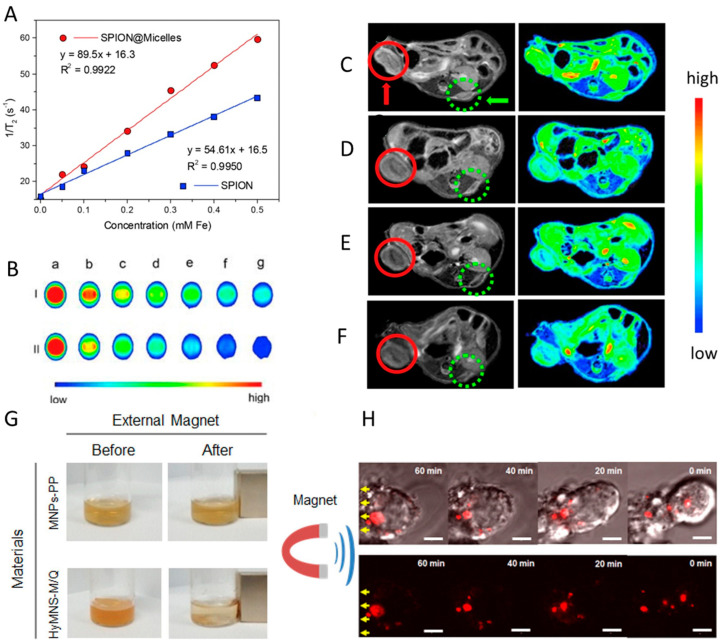
Figure 4.
Imaging features of magnetic micelles. T2-weight MRI images of SPIONs and SPION@micelles in vitro (A,B) and in vivo (C–F): (A) T2 relaxation rates as a function of iron (Fe) concentrations; (B) T2-weight MRI images of SPIONs (I) and SPION@ micelles (II) recorded on a 1.5 T clinical MRI instrument at different Fe concentrations (mM): a, 0; b, 0.05; c, 0.1; d, 0.2; e, 0.3; f, 0.4; g, 0.5; (C–F) In vivo T2-weighed MR images of HeLa tumor-bearing mice before (C) and after intravascular injection of SPION loaded micelles for (D) 1 h, (E) 3 h and (F) 7 h acquired on a 7.0 T MRI instrument. The tumors in the left and right flanks are identified by green dots and red circles, respectively. The magnetic field was applied to the right tumor while the left was not. (G) Photos showing the magnetic responses of polymeric micelles incorporating magnetic nanoparticles and quantum dots (HyMNS-M/Q), and magnetic nanoparticles coated with poly(maleic anhydride-alt-1-octadecene)-poly(ethylene glycol) (MNPs-PP) after applying an external magnetic field; (H) Real-time image of HyMNS-M/Q migration (yellow arrows) in the cytoplasm of a living cell under the external magnetic stimulus. Scale bar: 3 µm. Adapted with permission from Refs. [38, 89]. Copyright 2022, Elsevier.

