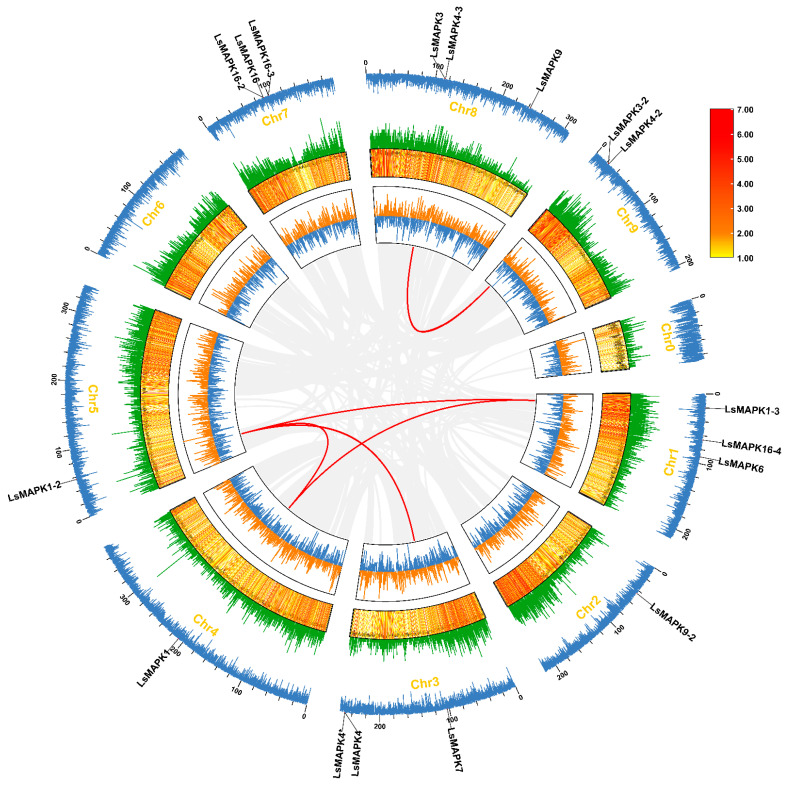
Figure 5.
Collinearity analysis of the LsMAPK gene family. The gray line in the background represents the homolinear pair in the whole lettuce genome, and the red line represents the homolinear pair of LsMAPKs. The information represented by each circle in the figure is GC skew, genome density heatmap, GC radio, genome density linear map, chromosome name, N radio, chromosome length scale, and LsMAPKs chromosome location annotation from inside to outside.

