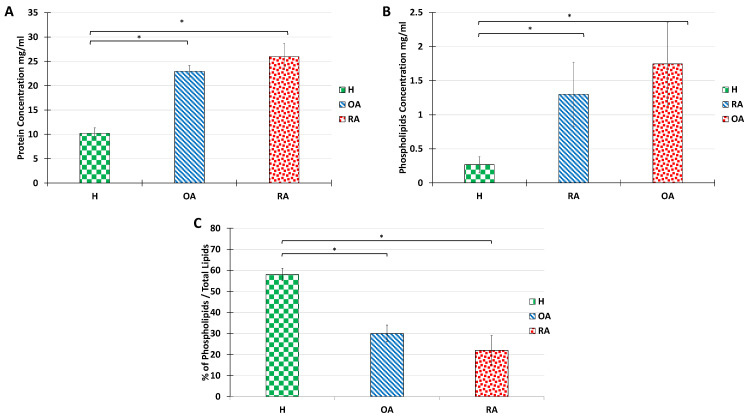
Figure 3.
Alterations in protein and total lipid concentration in SF from the knee joints of human healthy volunteers and OA or RA patients. Protein concentration (A), PL total amount (B), and PL percentage are calculated as the ratio of PL acyl chain molar concentration over total lipid acyl chain concentration (C). Data are presented as mean ± SD of 7 healthy, 3 OA, and 3 RA humans. p-values (t-test) less than 0.05 were considered significant (*).

