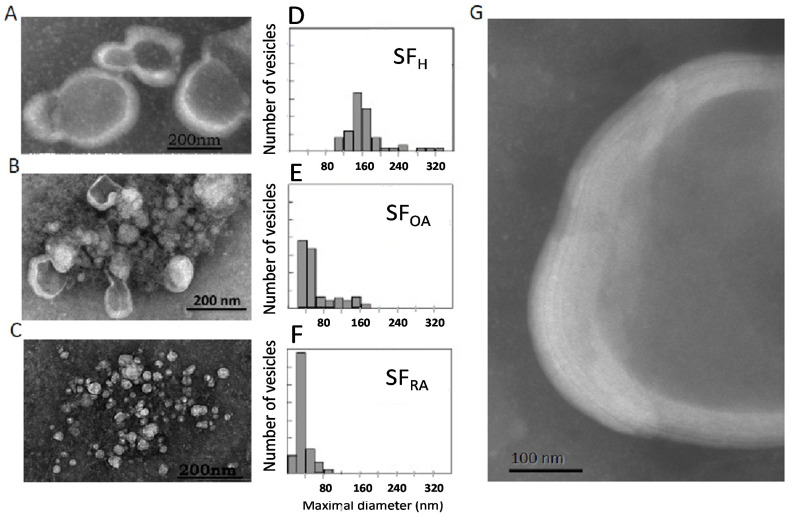
Figure 4.
Ultrastructure of representative samples of normal and pathological SF: Transmission electron microscopy of SF healthy donors (A) or SF from patients with OA (B) or RA (C). Size distribution of vesicles present in healthy SF samples (D), OA SF samples (E), or RA SF samples (F); Multilamellar structures characteristic of healthy SF samples in a 5 times enlargement of figure A (G). Size distribution analysis: (D) Min-Max: 100–556 nm; Med ± SD 157 ± 6 nm; (E) Min- Max: 30–171 nm; Med ± SD: 45 ± 5 nm (F) Min-Max: 30–171 nm; Med ± SD: 45 ± 5 nm.

