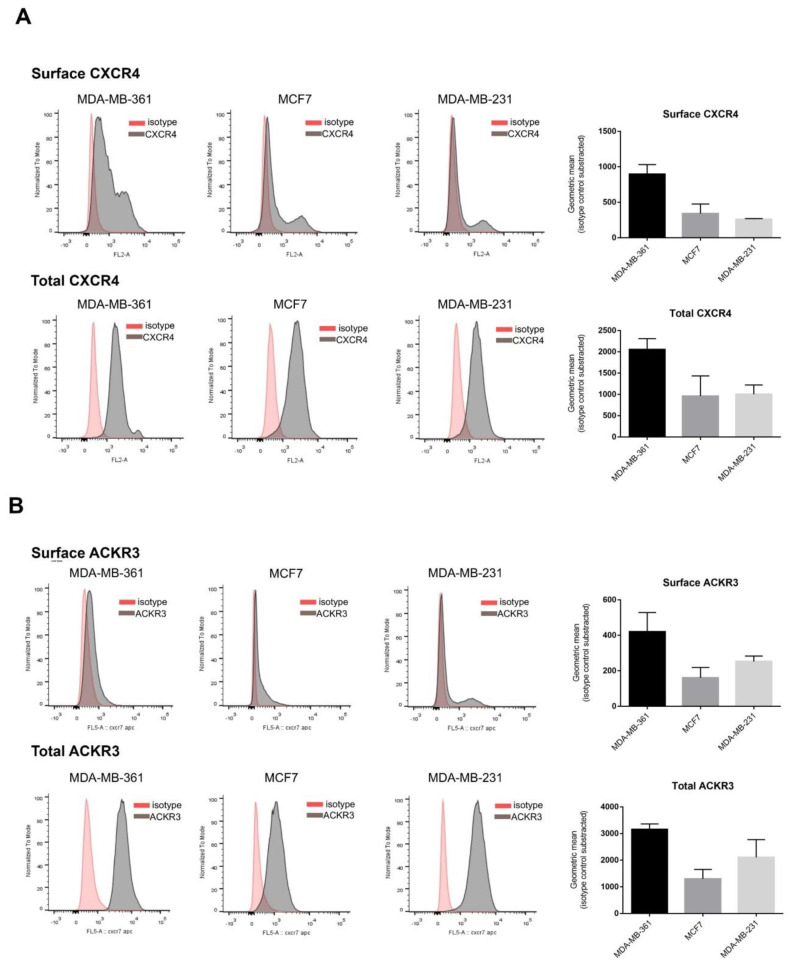
Figure 1.
Model breast cancer (BC) cell lines display heterogeneous expression profiles of CXCR4/ACKR3 chemokine receptors, with a sizable intracellular pool and different proportions of cell surface receptors. Analysis of CXCR4 (A) or ACKR3 (B) expression and subcellular distribution was performed by flow cytometry analysis as detailed in the Methods for detection of surface receptors (upper plots) and total cellular receptors (surface + cytoplasmic) (lower plots) in MDA-MB-361 (ER+ and Her2+), MCF7 (ER+) and MDA-MB-231 (triple negative) cells. Data (geometric mean fluorescence corrected by the substraction of isotype control) are represented as mean of GMF ± SEM of 2–3 independent experiments.

