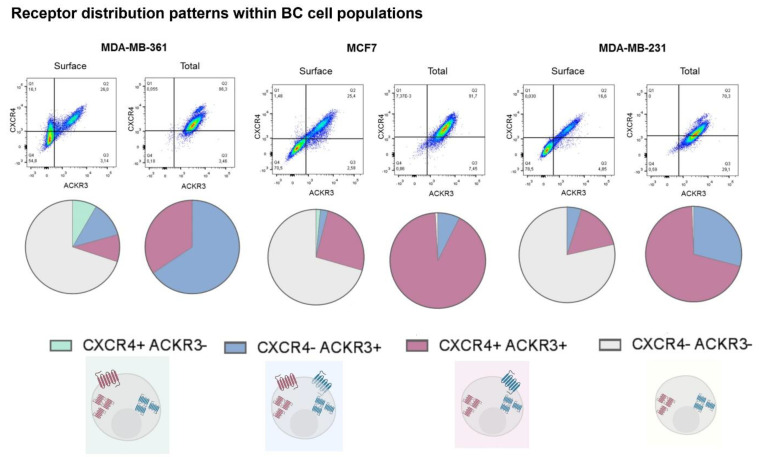
Figure 2.
Model breast cancer cell lines display heterogeneous patterns of CXCR4/ACKR3 distribution and different cell subpopulations can be defined according to the concurrence or not of both receptors. Pie charts show percentage distribution of MDA-MB-361 (ER+ and Her2+), MCF7 (ER+) and MDA-MB-231 (triple negative) cells for the different combinations of CXCR4 and/or ACKR3 presence at the cellular surface or in the total cell for each cell line in 3 independent experiments.

