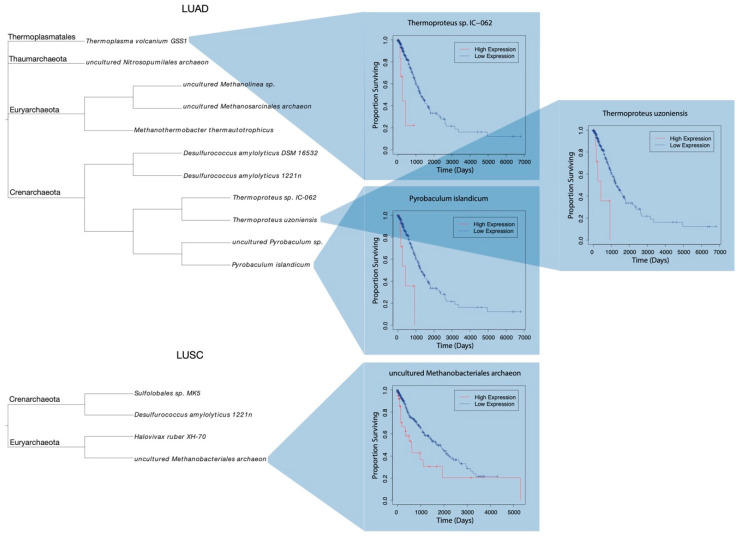
Figure 4.
Phylograms of species differentially abundant among LUAD and LUSC samples, with respect to patient clinical categorization. Respective taxonomic phylums are shown. Patients were classified as “high” or “low” abundance of a species. Select Kaplan–Meier survival plots of proportion of “high” and “low” abundance patients surviving with time.

