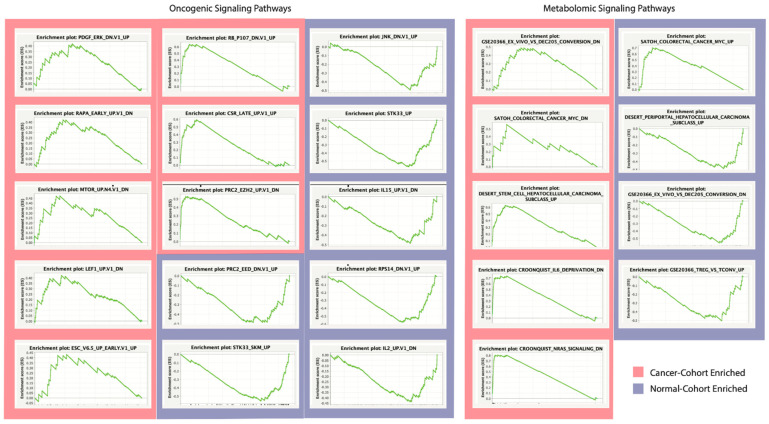
Figure 5.
GSEA Enrichment Plots. Gene sets significantly enriched in cancer sample cohorts (red) or normal sample cohorts (blue), with enrichment score magnitude and direction. Division of oncogenic associated and metabolomic associated signaling pathways of enrichment dysregulation. Signaling pathways of the largest peak height exhibit the greatest extent of dysregulation.

