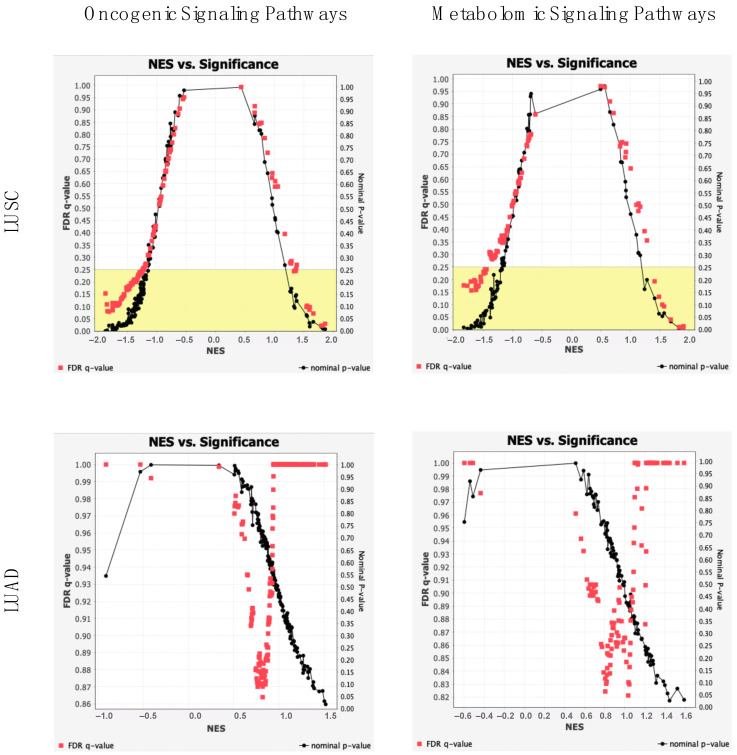
Figure 6.
GSEA Significance Plots. Displays of pathway NESs with associated nominal p-values (black) and FDR q-values (red) for LUAD and LUSC analyses. Division of oncogenic associated and metabolomic associated signaling pathways. Signaling pathways of the left and right extremes of graphs exhibit the greatest extent of dysregulation, while signaling pathways of the bottom portion are of the greatest significance. Yellow shaded region signifies q-values below 0.25.

