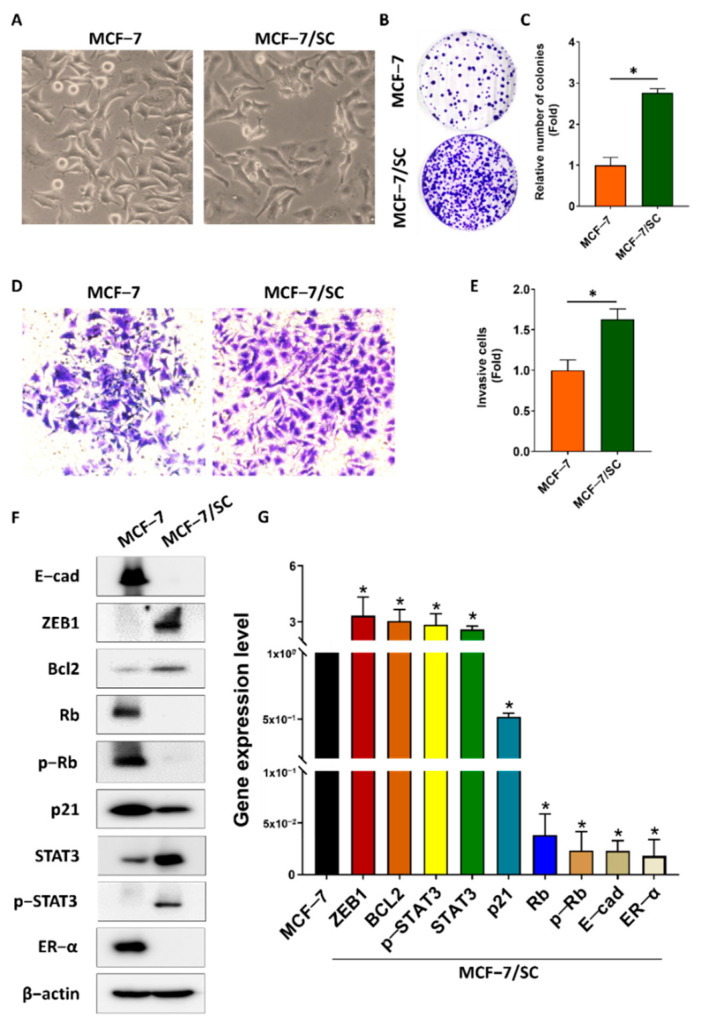
Figure 1.
Characterization of drug−resistant human breast cancer MCF−7/SC cells. (A) Comparison of morphology between MCF−7 and MCF−7/SC cells. (B,C) The number of colonies and (D,E) invasive cells analyzed to compare MCF−7 and MCF−7/SC cells. (F) Representative Western blot analysis for drug resistance markers. (G) Real−time PCR was performed to access the gene expression. β−actin was used as a loading control. The asterisk (*) indicates p < 0.05 vs. the control. Data are representative of three biologically independent experiments and values are shown in mean ± SD.

