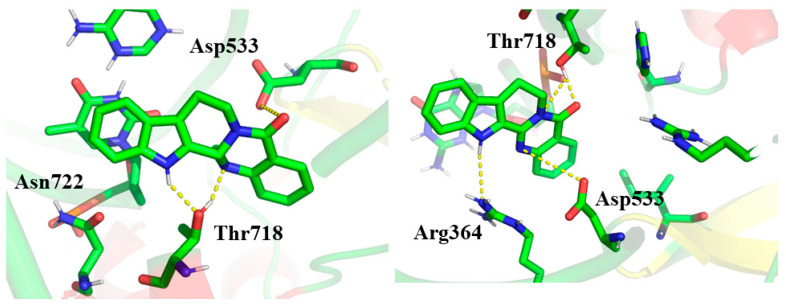
Figure 4.
Binding mode of evodiamine (EVO) (left) and rutaecarpine (RUT) (right) with the TOP1–DNA complex. The ligand and relevant amino acids are represented by a stick diagram (green for carbon atom, red for oxygen atom and blue for nitrogen atom), while TOP1-DNA is depicted by a cartoon diagram. Hydrogen bond interactions are shown in yellow dotted lines.

