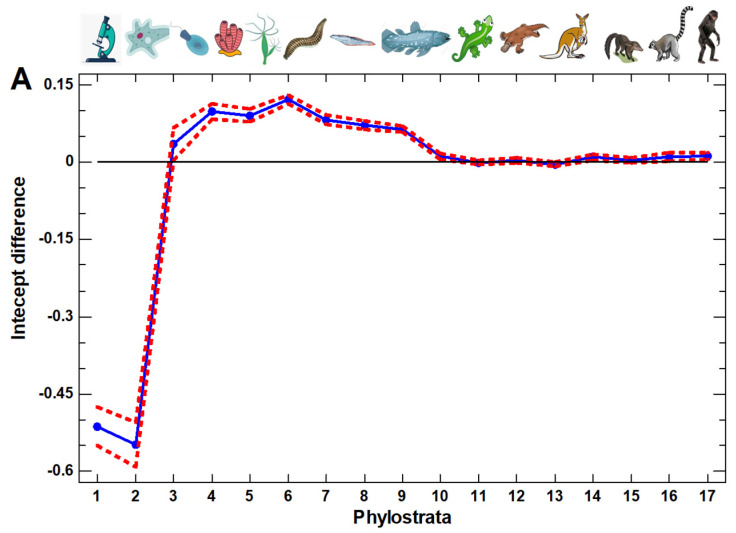
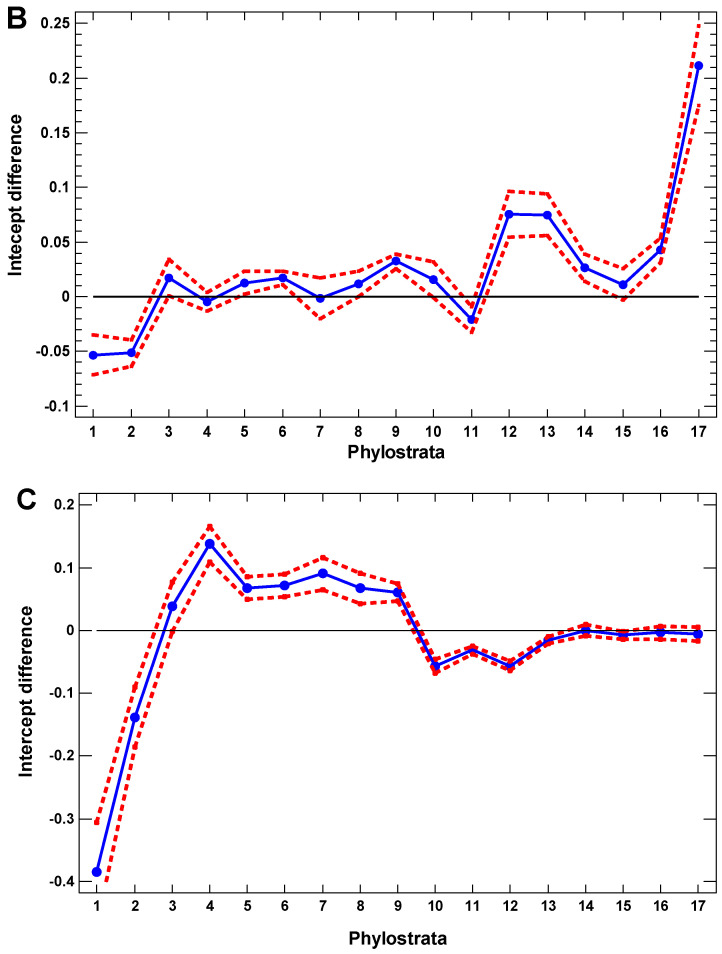
Figure 3.
Evolutionary profiles: the differences in the intercepts between the regression lines of the expression of genes belonging to different phylostrata on the cell cycle signature in the single-cell transcriptomes (regression lines as in Figure 1) for the different cell types, with confidence intervals (p = 0.05). (A) Multipotent progenitors (differentiated from ESC) vs. ESC (GSE75748, ‘cell type’ dataset). (B) Erythrocytes (differentiated from erythroblasts) vs. erythroblasts (GSE123899). (C) Hepatocyte-like cells (differentiated from iPSC) vs. iPSC (GSE90749). Phylostrata: 1—cellular organisms (Prokaryota); 2—Eukaryota; 3—Opisthokonta; 4—Metazoa; 5—Eumetazoa; 6—Bilateria; 7—Chordata; 8—Vertebrata; 9—Euteleostomi; 10—Tetrapoda; 11—Amniota; 12—Mammalia; 13—Theria; 14—Eutheria; 15—Boreoeutheria; 16—Primates; 17—Hominidae. The pictures at the top show recent organisms corresponding to the phyletic branching used for human gene dating.


