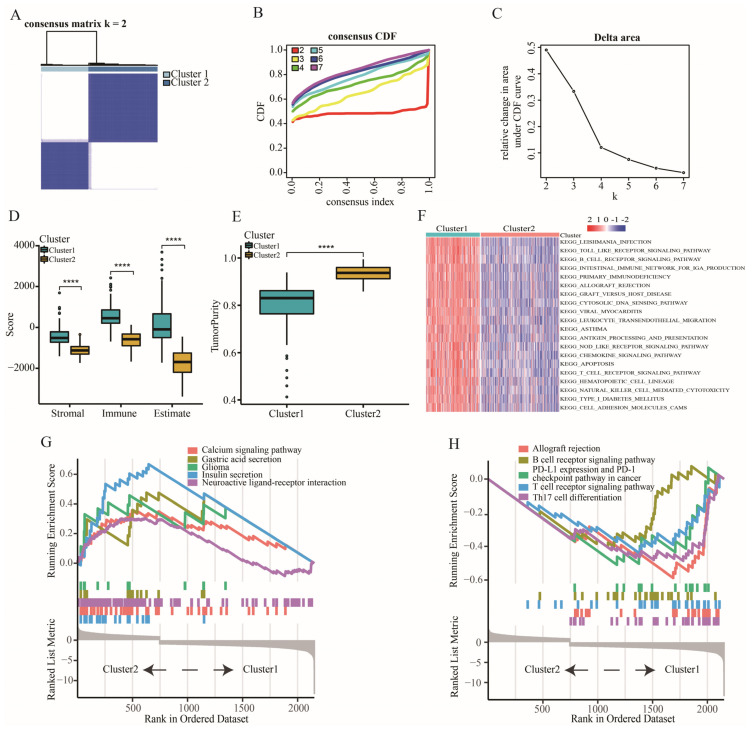
Figure 1.
The classification and characteristic of immune subtypes. (A–C) Identification of two immune subtypes using consensus clustering analysis. (D) The expression of stromal, immune, and estimate scores between cluster 1 and cluster 2. (E) The difference of tumor purity between cluster 1 and cluster 2. (F) GSVA analysis of biological pathways between cluster 1 and cluster 2. (G) GSEA analysis showing the pathways enriched in cluster 2. (H) GSEA analysis showing the pathways enriched in cluster 1. Data in (D,E) were analyzed by Wilcoxon test; **** p < 0.0001.

