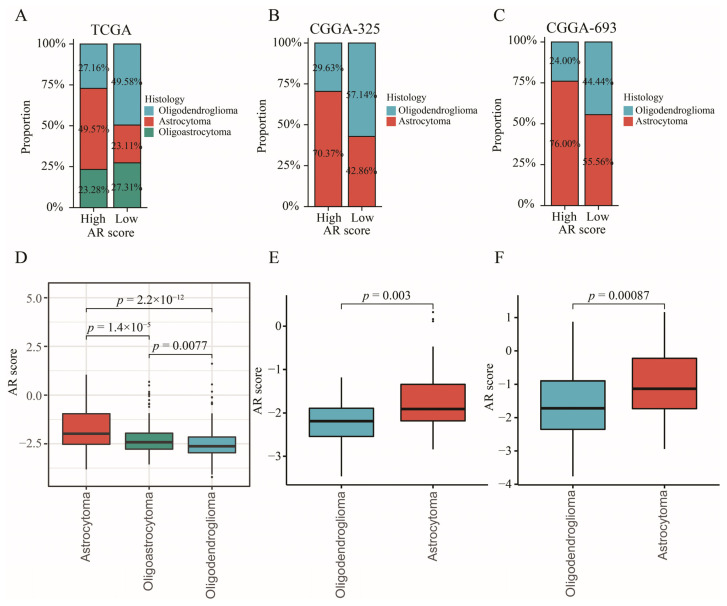
Figure 9.
The relationship between AR-related signature and histology. (A–C) The proportion of histological distribution between high- and low-AR groups in TCGA, CGGA-325, and CGGA-693, respectively. (D–F) The comparisons of AR scores in different histological subtypes in TCGA, CGGA-325, and CGGA-693, respectively.

