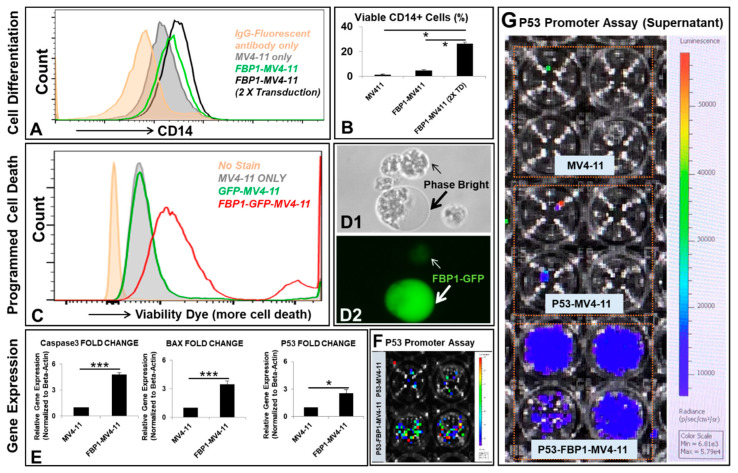
Figure 2.
Molecular phenotypes of the FBP1-MV4-11 cell line in vitro: (A) A representative FC histogram showing CD14 expression in different MV4-11 cell lines, including naïve MV4-11, FBP1-MV4-11, and FBP1-MV4-11 cells with double FBP1 lentiviral transduction; the histogram of GFP+ expression in these cell lines can be found in Supplementary Figure S1. (B) Cumulative FC percentage data of CD14+ cells in different MV4-11 cell lines from (A). (C) A representative FC histogram showing the expression of viability dye (more expression representing more cell death) in FBP1-MV4-11 (red line plot), GFP-MV4-11 (green line plot), and MV4-11 cells (filled gray plot); the filled orange plot represents the unstained control. (D1,D2) Representative phase-bright and fluorescent images (20×) showing some GFP+ FBP1-MV4-11 cells that were abnormally larger (indicated by a large arrow) than their neighboring cells; the small arrow indicates a dying cell with weak GFP+. (E) Gene expression of programmed cell death proteins in FBP1-MV4-11 cells was analyzed by qPCR; data of mRNA expression show the fold change (normalized to β-actin) of genes encoding caspase-3, BAX, and P53. (F,G) P53 promoter assay of blasts and their supernatants was performed (see details in the Materials and Methods); representative live images show luciferase activity in MV4-11 and FBP1-MV4-11 blasts (F) and supernatants from different experimental groups (G). Where applicable, data are means ± SEM and were analyzed by Student’s “t”-test; * p < 0.05, *** p < 0.005, n = 3.

