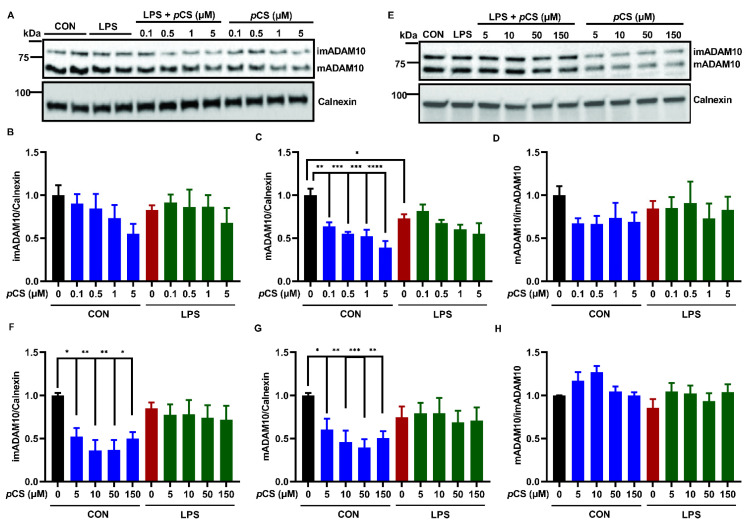
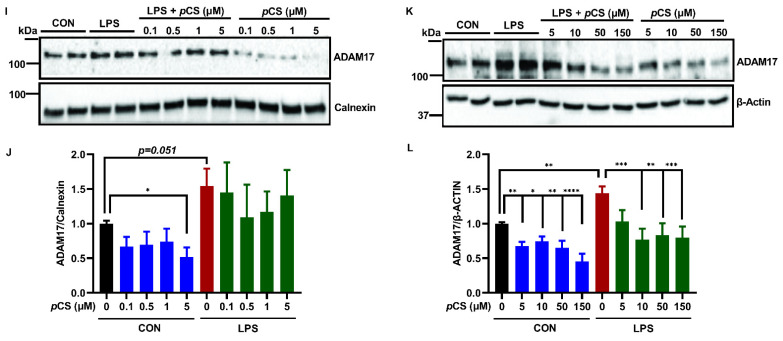
Figure 1.
Effect of pCS on ADAM10 and ADAM17 expression of constitutive and LPS-activated BV2 microglial cells. BV2 microglia were incubated with pCS for 24 h in the absence or presence of 1000 ng/mL LPS. Cell lysate was collected for WB analysis. (A) The representative immunoblots of ADAM10 protein expression with low concentration range of pCS. (B–D) The quantification results of immature ADAM10 (imADAM10), and mature ADAM10 (mADAM10) and maturation efficiency (ratio mADAM10/imADAM10) of BV2 cells exposed to a low concentration range of pCS (n = 4 independent experiments). (E) The representative immunoblots of ADAM10 protein expression with a high concentration range of pCS. (F–H) The quantification results of ADAM10 protein expression of BV2 cells exposed to a high concentration range of pCS treatment (n = 5 independent experiments). (I) The representative immunoblots of ADAM17 protein expression with low concentration range of pCS. (J) The quantification results of ADAM17 protein expression with low concentration range of pCS (n = 4 independent experiments). (K) The representative immunoblots of ADAM17 protein expression with a high concentration range of pCS. (L) The quantification results of ADAM17 protein expression with a high concentration range of pCS (n = 6 independent experiments). Calnexin or β-Actin were used as a loading controls. Black: constitutive protein expression set at 1; red: LPS-induced protein expression; blue: effect of pCS on constitutive protein expression; green: effect of pCS on LPS-induced protein expression. Results were expressed as mean ± SEM. * p < 0.05, ** p < 0.01, *** p < 0.001, **** p < 0.0001.


